Neighborhood C (C) neighborhood in Rohnert Park, California (CA), 94928, 94931 detailed profile
Settings
X


Business Search - 14 Million verified businesses
Area: 0.394 square miles
Population: 3,510
Population density:
| Neighborhood C (C): | 8,914 people per square mile |
| Rohnert Park: | 6,910 people per square mile |

- 1,80249.8%White
- 1,24734.5%Hispanic or Latino
- 1664.6%Two or more races
- 1614.4%Asian
- 1393.8%Black
- 772.1%Native Hawaiian and Other
Pacific Islander - 170.5%Some other race
- 90.2%American Indian

Median household income in 2022:
| Neighborhood C (C): | $93,469 |
| Rohnert Park: | $93,322 |
Distribution of median household income
![Distribution of median household income]()
- 36Less than $10,000
- 184$10,000 to $19,999
- 78$20,000 to $29,999
- 154$30,000 to $39,999
- 255$40,000 to $49,999
- 122$50,000 to $59,999
- 99$60,000 to $74,999
- 330$75,000 to $99,999
- 267$100,000 to $124,999
- 120$125,000 to $149,999
- 81$150,000 to $199,999
- 100$200,000 or more

Distribution of owner-occupied house/condo value
![Distribution of owner-occupied house/condo value]()
- 258Less than $50,000
- 572$50,000 to $99,999
- 54$100,000 to $149,999
- 320$150,000 to $199,999
- 25$200,000 to $249,999
- 165$250,000 to $299,999
- 52$300,000 to $399,999
- 189$400,000 to $499,999
- 404$500,000 to $749,999
- 40$750,000 to $999,999
- 66$1,000,000 or more

Distribution of rent paid by renters
![Distribution of rent paid by renters]()
- 43$100 to $199
- 31$200 to $299
- 195$300 to $399
- 30$400 to $499
- 119$500 to $599
- 30$600 to $699
- 33$700 to $799
- 47$800 to $899
- 28$900 to $999
- 89$1,000 to $1,249
- 111$1,250 to $1,499
- 197$1,500 to $1,999
- 540$2,000 or more

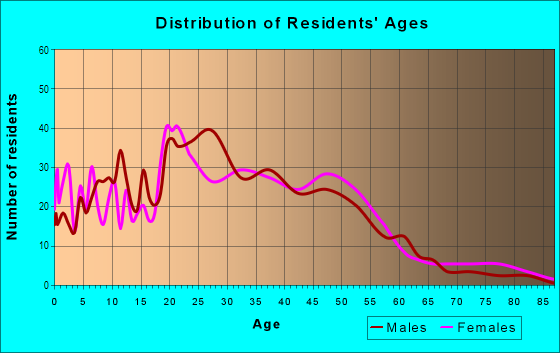
| Males: | 1,658 |
| Females: | 1,852 |
Males:
| This neighborhood: | 35.3 years |
| Whole city: | 35.9 years |
| This neighborhood: | 34.6 years |
| Whole city: | 34.5 years |
Average household size:
| Neighborhood C (C): | 2.5 people |
| Rohnert Park: | 2.6 people |
Percentage of family households:
| Neighborhood C (C): | 35.3% |
| Rohnert Park: | 43.9% |
| Here: | 34.7% |
| Rohnert Park: | 43.1% |
Percentage of married-couple families with children (among all households):
| Neighborhood C (C): | 23.1% |
| Rohnert Park: | 24.7% |
Percentage of single-mother households (among all households):
| Neighborhood C (C): | 5.9% |
| Rohnert Park: | 10.3% |
Percentage of never married males 15 years old and over:
Percentage of never married females 15 years old and over:
| Neighborhood C (C): | 20.7% |
| Rohnert Park: | 20.3% |
Percentage of never married females 15 years old and over:
| Neighborhood C (C): | 27.6% |
| city: | 21.1% |
Percentage of people that speak English not well or not at all:
| Neighborhood C (C): | 3.0% |
| Rohnert Park: | 3.7% |
Percentage of people born in this state:
Percentage of people born in another U.S. state:
Percentage of native residents but born outside the U.S.:
Percentage of foreign born residents:
| Here: | 68.0% |
| Rohnert Park: | 65.7% |
Percentage of people born in another U.S. state:
| Neighborhood C (C): | 17.8% |
| Rohnert Park: | 18.6% |
Percentage of native residents but born outside the U.S.:
| Here: | 0.4% |
| city: | 1.1% |
Percentage of foreign born residents:
| Here: | 13.8% |
| Rohnert Park: | 14.5% |

Owner-occupied
Renter-occupied


- Rooms in owner-occupied houses and condos in Neighborhood C <
> - 01 room
- 472 rooms
- 1083 rooms
- 1634 rooms
- 2085 rooms
- 1056 rooms
- 2067 rooms
- 528 rooms
- 1139+ rooms

- Rooms in renter-occupied apartments in Neighborhood C <
> - 681 room
- 742 rooms
- 1283 rooms
- 2014 rooms
- 1965 rooms
- 1086 rooms
- 287 rooms
- 298 rooms
- 129+ rooms
Owner-occupied
Renter-occupied

- Bedrooms in owner-occupied houses and condos in Neighborhood C <
> - 21no bedroom
- 1681 bedroom
- 2212 bedrooms
- 2923 bedrooms
- 2024 bedrooms
- 695+ bedrooms

- Bedrooms in renter-occupied apartments in Neighborhood C <
> - 73no bedroom
- 1391 bedroom
- 3982 bedrooms
- 853 bedrooms
- 1224 bedrooms
- 175+ bedrooms
Average number of cars or other vehicles available in houses/condos:
Average number of cars or other vehicles available in apartments:
| This neighborhood: | 2.2 |
| Rohnert Park: | 2.3 |
Average number of cars or other vehicles available in apartments:
| Here: | 1.9 |
| city: | 1.9 |
Percentage of units with a mortgage:
| Neighborhood C (C): | 68.1% |
| Rohnert Park: | 69.0% |
Housing prices:
- Average estimated value of detached houses in 2022 (40.8% of all units):
Neighborhood C (C): $770,035 Rohnert Park: $718,881
- Average estimated value of townhouses or other attached units in 2022 (11.7% of all units):
This neighborhood: $347,707 city: $452,176

- Year house built in Neighborhood C <
> - 272020 or later
- 892010 to 2019
- 352000 to 2009
- 531990 to 1999
- 4491980 to 1989
- 6911970 to 1979
- 2501960 to 1969
- 1591950 to 1959
- 691940 to 1949
- 991939 or earlier

City-data.com crime index for city in 2020 (higher means more crime):
| City: | 266.5 |
| U.S. average: | 219.5 |
Travel time to work (commute)
![Travel time to work (commute)]()
- 60Less than 5 minutes
- 3225 to 9 minutes
- 28310 to 14 minutes
- 37615 to 19 minutes
- 42420 to 24 minutes
- 10425 to 29 minutes
- 19130 to 34 minutes
- 8935 to 39 minutes
- 4240 to 44 minutes
- 22745 to 59 minutes
- 8660 to 89 minutes
- 3590 or more minutes

Means of transportation to work
![Means of transportation to work]()
- 72.5%1,552Drove a car alone
- 12.9%277Carpooled
- 0.5%10Bus
- 3.6%78Subway or elevated rail
- 1.8%38Long-distance train or commuter rail
- 13.7%293Taxi
- 1.6%35Motorcycle
- 1.4%29Bicycle
- 1.7%37Walked
- 1.4%29Other means
- 5.6%119Worked at home

Time leaving home to go to work
![Time leaving home to go to work]()
- 7212:00 a.m. to 4:59 a.m.
- 495:00 a.m. to 5:29 a.m.
- 1215:30 a.m. to 5:59 a.m.
- 1036:00 a.m. to 6:29 a.m.
- 2226:30 a.m. to 6:59 a.m.
- 2087:00 a.m. to 7:29 a.m.
- 3117:30 a.m. to 7:59 a.m.
- 2638:00 a.m. to 8:29 a.m.
- 898:30 a.m. to 8:59 a.m.
- 1849:00 a.m. to 9:59 a.m.
- 7710:00 a.m. to 10:59 a.m.
- 7711:00 a.m. to 11:59 a.m.
- 24712:00 p.m. to 3:59 p.m.
- 1474:00 p.m. to 11:59 p.m.

Occupations of males:
- Percentage of males in management occupations (except farmers):
Here: 6.8% city: 10.9%
- Percentage of males in business and financial operations occupations:
Here: 5.4% city: 3.0%
- Percentage of males in computer and mathematical occupations:
Here: 6.2% city: 4.9%
- Percentage of males in architecture and engineering occupations:
Here: 4.0% city: 2.7%
- Percentage of males in legal occupations:
Here: 3.1% city: 1.0%
- Percentage of males in education, training, and library occupations:
Here: 1.7% city: 1.7%
- Percentage of males in arts, design, entertainment, sports, and media occupations:
Here: 3.0% city: 1.7%
- Percentage of males in healthcare practitioners and technical occupations:
Here: 1.6% city: 3.6%
- Percentage of males in service occupations:
Here: 11.9% city: 20.6%
- Percentage of males in sales and office occupations:
Here: 14.2% city: 16.7%
- Percentage of males in construction, extraction, and maintenance occupations:
Here: 23.3% city: 15.5%
- Percentage of males in production occupations:
Here: 4.4% city: 3.8%
- Percentage of males in transportation occupations:
Here: 4.5% city: 4.0%
- Percentage of males in material moving occupations:
Here: 5.2% city: 4.2%
Occupations of females:
- Percentage of females in management occupations (except farmers):
Here: 4.0% city: 7.5%
- Percentage of females in business and financial operations occupations:
Here: 3.5% city: 5.5%
- Percentage of females in computer and mathematical occupations:
Here: 1.2% city: 0.9%
- Percentage of females in architecture and engineering occupations:
Here: 2.4% city: 0.9%
- Percentage of females in legal occupations:
Here: 3.2% city: 0.9%
- Percentage of females in education, training, and library occupations:
Here: 9.7% city: 9.5%
- Percentage of females in arts, design, entertainment, sports, and media occupations:
Here: 2.1% city: 2.4%
- Percentage of females in healthcare practitioners and technical occupations:
Here: 3.5% city: 8.1%
- Percentage of females in service occupations:
Here: 30.6% city: 24.0%
- Percentage of females in sales and office occupations:
Here: 39.3% city: 30.9%
Percentage of people 16-64 in Armed Forces:
| Neighborhood C (C): | 0.1% |
| Rohnert Park: | 0.2% |
Education in this neighborhood (subdivision or community):
- Percentage of people 3 years and older in K-12 schools:
Neighborhood C (C): 18.4% Rohnert Park: 15.1%
- Percentage of people 3 years and older in undergraduate colleges:
Neighborhood C (C): 15.8% Rohnert Park: 10.5%
- Percentage of people 3 years and older in grad. or professional schools:
Neighborhood C (C): 2.9% Rohnert Park: 0.9%
- Percentage of students K-12 enrolled in private schools:
Neighborhood C (C): 10.3% Rohnert Park: 4.1%
Percentage of population below poverty level:
| Neighborhood C (C): | 13.0% |
| Rohnert Park: | 9.7% |
Median year owner moved in (as recorded in 2022):
| Neighborhood C (C): | 2005 |
| Rohnert Park: | 2008 |
Percentage of married-couple families with both working:
| Neighborhood C (C): | 366.4% |
| Rohnert Park: | 74.9% |

- 47.8%Utility gas
- 36.6%Electricity
- 6.9%No fuel used
- 4.3%Other fuel
- 1.8%Bottled, tank, or LP gas
- 1.7%Wood
- 1.0%Solar energy
Roads and streets:
Southwest Blvd
Length: 1.52 miles
Directions: E-W, SE-NW, SW-NE
Address range: 600 to 1499
Directions: E-W, SE-NW, SW-NE
Address range: 600 to 1499
Circle Dr
Length: 1.25 miles
Directions: E-W, N-S, SE-NW, SW-NE
Address range: 7186 to 7429
Directions: E-W, N-S, SE-NW, SW-NE
Address range: 7186 to 7429
E Cotati Ave
Length: 0.87 miles
Directions: E-W, SW-NE
Address range: 1000 to 1603
Directions: E-W, SW-NE
Address range: 1000 to 1603
Snyder Ln
Length: 0.80 miles
Directions: N-S, SE-NW, SW-NE
Address range: 5411 to 7299
Directions: N-S, SE-NW, SW-NE
Address range: 5411 to 7299
Cam Coronado
Length: 0.59 miles
Directions: E-W, N-S, SE-NW
Address range: 936 to 1347
Directions: E-W, N-S, SE-NW
Address range: 936 to 1347
Carlita Cir
Length: 0.53 miles
Directions: E-W, SE-NW
Address range: 735 to 844
Directions: E-W, SE-NW
Address range: 735 to 844
Cam Colegio
Length: 0.44 miles
Directions: N-S, SE-NW
Address range: 7100 to 7498
Directions: N-S, SE-NW
Address range: 7100 to 7498
Ave Cala
Length: 0.40 miles
Directions: N-S, SW-NE
Address range: 5300 to 7158
Directions: N-S, SW-NE
Address range: 5300 to 7158
Cielo Cir
Length: 0.36 miles
Directions: E-W, N-S, SE-NW, SW-NE
Address range: 1100 to 1199
Directions: E-W, N-S, SE-NW, SW-NE
Address range: 1100 to 1199
Cam Corto
Length: 0.24 miles
Direction: E-W
Address range: 1201 to 1451
Direction: E-W
Address range: 1201 to 1451
Cornell Ave
Length: 0.15 miles
Direction: E-W
Address range: 7319 to 7357
Direction: E-W
Address range: 7319 to 7357
Sunflower Dr
Length: 0.15 miles
Directions: E-W, N-S, SE-NW
Directions: E-W, N-S, SE-NW
Country Club Dr
Length: 0.14 miles
Directions: N-S, SE-NW
Address range: 6800 to 6861
Directions: N-S, SE-NW
Address range: 6800 to 6861
Corsica Ct
Length: 0.11 miles
Direction: E-W
Address range: 7320 to 7354
Direction: E-W
Address range: 7320 to 7354
Cala Way
Length: 0.11 miles
Directions: E-W, N-S, SW-NE
Address range: 1200 to 1299
Directions: E-W, N-S, SW-NE
Address range: 1200 to 1299
Calcutta Ct
Length: 0.10 miles
Directions: E-W, N-S, SW-NE
Address range: 7278 to 7299
Directions: E-W, N-S, SW-NE
Address range: 7278 to 7299
Capri Way
Length: 0.10 miles
Direction: E-W
Address range: 1200 to 1225
Direction: E-W
Address range: 1200 to 1225
Carioca Ct
Length: 0.10 miles
Direction: E-W
Address range: 7300 to 7399
Direction: E-W
Address range: 7300 to 7399
Castille Ct (Castile Ct)
Length: 0.09 miles
Directions: E-W, SW-NE
Address range: 7339 to 7357
Directions: E-W, SW-NE
Address range: 7339 to 7357
Corinth Ct
Length: 0.08 miles
Direction: E-W
Address range: 7270 to 7301
Direction: E-W
Address range: 7270 to 7301
Coronado Ct
Length: 0.07 miles
Direction: N-S
Address range: 5290 to 5325
Direction: N-S
Address range: 5290 to 5325
Carillon Ct
Length: 0.06 miles
Direction: N-S
Address range: 7119 to 7154
Direction: N-S
Address range: 7119 to 7154
Windmill Farms Dr
Length: 0.06 miles
Directions: E-W, SE-NW
Directions: E-W, SE-NW
Casa Way
Length: 0.06 miles
Direction: E-W
Address range: 7225 to 7276
Direction: E-W
Address range: 7225 to 7276
Caridad Ct
Length: 0.05 miles
Direction: SE-NW
Address range: 1218 to 1249
Direction: SE-NW
Address range: 1218 to 1249
Cloister Ct
Length: 0.05 miles
Direction: SE-NW
Address range: 1123 to 1251
Direction: SE-NW
Address range: 1123 to 1251
Carriage Ct
Length: 0.04 miles
Direction: E-W
Address range: 7364 to 7399
Direction: E-W
Address range: 7364 to 7399
Crest Ct
Length: 0.04 miles
Direction: E-W
Address range: 1226 to 1251
Direction: E-W
Address range: 1226 to 1251
Cairo Ct
Length: 0.03 miles
Direction: SW-NE
Address range: 7271 to 7999
Direction: SW-NE
Address range: 7271 to 7999
Callecita Ct
Length: 0.03 miles
Direction: SW-NE
Address range: 5245 to 5259
Direction: SW-NE
Address range: 5245 to 5259
Cadiz Ct
Length: 0.03 miles
Direction: E-W
Address range: 7228 to 7241
Direction: E-W
Address range: 7228 to 7241
Coral Ct
Length: 0.03 miles
Direction: SW-NE
Address range: 7355 to 7364
Direction: SW-NE
Address range: 7355 to 7364
Railroad features:
Northwestern Pacific RR
Length: 0.91 miles
Direction: SE-NW
Direction: SE-NW
Other features:
Copeland Crk
Length: 0.90 miles
Direction: E-W
Direction: E-W