Murphy neighborhood in Blacksburg, Virginia (VA), 24060 detailed profile
Settings
X


Business Search - 14 Million verified businesses
Area: 0.278 square miles
Population: 340
Population density:
| Murphy: | 1,224 people per square mile |
| Blacksburg: | 2,332 people per square mile |

- 30889.5%White
- 216.1%Two or more races
- 72.0%Some other race
- 51.5%Asian
- 20.6%Black
- 10.3%Hispanic or Latino

Median household income in 2022:
| Murphy: | $56,466 |
| Blacksburg: | $42,012 |
Distribution of median household income
![Distribution of median household income]()
- 23Less than $10,000
- 5$10,000 to $19,999
- 16$20,000 to $29,999
- 6$30,000 to $39,999
- 6$40,000 to $49,999
- 6$50,000 to $59,999
- 11$60,000 to $74,999
- 12$75,000 to $99,999
- 11$100,000 to $124,999
- 6$125,000 to $149,999
- 13$150,000 to $199,999
- 19$200,000 or more

Distribution of owner-occupied house/condo value
![Distribution of owner-occupied house/condo value]()
- 2$100,000 to $149,999
- 1$150,000 to $199,999
- 10$200,000 to $249,999
- 3$250,000 to $299,999
- 11$300,000 to $399,999
- 19$400,000 to $499,999
- 14$500,000 to $749,999
- 4$750,000 to $999,999

Distribution of rent paid by renters
![Distribution of rent paid by renters]()
- 1$200 to $299
- 4$500 to $599
- 5$600 to $699
- 7$700 to $799
- 6$800 to $899
- 3$900 to $999
- 9$1,000 to $1,249
- 3$1,250 to $1,499
- 12$1,500 to $1,999
- 19$2,000 or more

Median rent in 2022:
| Murphy: | $1,587 |
| Blacksburg: | $1,146 |
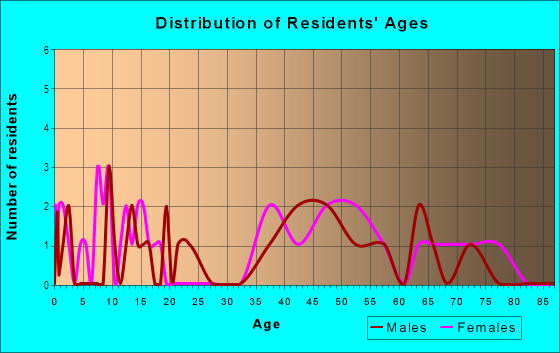
| Males: | 150 |
| Females: | 189 |
Males:
| This neighborhood: | 21.8 years |
| Whole city: | 21.6 years |
| This neighborhood: | 21.0 years |
| Whole city: | 21.8 years |
Average household size:
| Murphy: | 3.1 people |
| Blacksburg: | 2.6 people |
Percentage of family households:
| Murphy: | 34.5% |
| Blacksburg: | 26.3% |
| Here: | 44.6% |
| Blacksburg: | 31.1% |
Percentage of married-couple families with children (among all households):
| Murphy: | 22.6% |
| Blacksburg: | 25.9% |
Percentage of single-mother households (among all households):
| Murphy: | 9.7% |
| Blacksburg: | 2.9% |
Percentage of never married males 15 years old and over:
Percentage of never married females 15 years old and over:
| Murphy: | 29.0% |
| Blacksburg: | 42.8% |
Percentage of never married females 15 years old and over:
| Murphy: | 32.2% |
| town: | 30.2% |
Percentage of people that speak English not well or not at all:
| Murphy: | 0.0% |
| Blacksburg: | 0.4% |
Percentage of people born in this state:
Percentage of people born in another U.S. state:
Percentage of native residents but born outside the U.S.:
Percentage of foreign born residents:
| Here: | 39.1% |
| Blacksburg: | 46.3% |
Percentage of people born in another U.S. state:
| Murphy: | 46.6% |
| Blacksburg: | 39.2% |
Percentage of native residents but born outside the U.S.:
| Here: | 1.4% |
| town: | 1.5% |
Percentage of foreign born residents:
| Here: | 12.9% |
| Blacksburg: | 13.1% |

Owner-occupied
Renter-occupied


- Rooms in owner-occupied houses and condos in Murphy
- 01 room
- 02 rooms
- 03 rooms
- 24 rooms
- 25 rooms
- 56 rooms
- 67 rooms
- 138 rooms
- 289+ rooms

- Rooms in renter-occupied apartments in Murphy
- 01 room
- 12 rooms
- 103 rooms
- 124 rooms
- 235 rooms
- 116 rooms
- 17 rooms
- 28 rooms
- 89+ rooms
Owner-occupied
Renter-occupied

- Bedrooms in owner-occupied houses and condos in Murphy
- 0no bedroom
- 01 bedroom
- 22 bedrooms
- 53 bedrooms
- 434 bedrooms
- 45+ bedrooms

- Bedrooms in renter-occupied apartments in Murphy
- 0no bedroom
- 81 bedroom
- 82 bedrooms
- 113 bedrooms
- 314 bedrooms
- 65+ bedrooms
Average number of cars or other vehicles available in houses/condos:
Average number of cars or other vehicles available in apartments:
| This neighborhood: | 2.1 |
| Blacksburg: | 2.1 |
Average number of cars or other vehicles available in apartments:
| Here: | 2.1 |
| town: | 1.7 |
Percentage of units with a mortgage:
| Murphy: | 53.6% |
| Blacksburg: | 52.1% |
Average estimated value of detached houses in 2022 (54.6% of all units):
| Murphy: | $428,281 |
| Blacksburg: | $426,247 |

- Year house built in Murphy
- 02020 or later
- 302010 to 2019
- 332000 to 2009
- 151990 to 1999
- 211980 to 1989
- 121970 to 1979
- 171960 to 1969
- 91950 to 1959
- 101940 to 1949
- 11939 or earlier

City-data.com crime index for town in 2020 (higher means more crime):
| City: | 62.3 |
| U.S. average: | 219.5 |
Travel time to work (commute)
![Travel time to work (commute)]()
- 10Less than 5 minutes
- 275 to 9 minutes
- 3910 to 14 minutes
- 1815 to 19 minutes
- 1820 to 24 minutes
- 125 to 29 minutes
- 530 to 34 minutes
- 245 to 59 minutes
- 160 to 89 minutes
- 190 or more minutes

Means of transportation to work
![Means of transportation to work]()
- 78.3%88Drove a car alone
- 4.4%5Carpooled
- 5.3%6Bus
- 2.7%3Walked
- 7.1%8Worked at home

Time leaving home to go to work
![Time leaving home to go to work]()
- 56:00 a.m. to 6:29 a.m.
- 16:30 a.m. to 6:59 a.m.
- 177:00 a.m. to 7:29 a.m.
- 147:30 a.m. to 7:59 a.m.
- 208:00 a.m. to 8:29 a.m.
- 278:30 a.m. to 8:59 a.m.
- 209:00 a.m. to 9:59 a.m.
- 610:00 a.m. to 10:59 a.m.
- 311:00 a.m. to 11:59 a.m.
- 212:00 p.m. to 3:59 p.m.
- 74:00 p.m. to 11:59 p.m.

Occupations of males:
- Percentage of males in management occupations (except farmers):
Here: 25.2% town: 9.2%
- Percentage of males in business and financial operations occupations:
Here: 4.3% town: 2.8%
- Percentage of males in computer and mathematical occupations:
Here: 16.1% town: 8.5%
- Percentage of males in architecture and engineering occupations:
Here: 7.0% town: 4.1%
- Percentage of males in life, physical, and social science occupations:
Here: 3.5% town: 7.6%
- Percentage of males in community and social services occupations:
Here: 3.3% town: 1.3%
- Percentage of males in legal occupations:
Here: 1.5% town: 0.3%
- Percentage of males in education, training, and library occupations:
Here: 30.8% town: 21.1%
- Percentage of males in arts, design, entertainment, sports, and media occupations:
Here: 9.3% town: 2.0%
- Percentage of males in healthcare practitioners and technical occupations:
Here: 3.6% town: 1.2%
- Percentage of males in service occupations:
Here: 3.5% town: 20.2%
- Percentage of males in sales and office occupations:
Here: 3.5% town: 11.8%
- Percentage of males in production occupations:
Here: 2.1% town: 1.7%
- Percentage of males in material moving occupations:
Here: 4.0% town: 4.0%
Occupations of females:
- Percentage of females in management occupations (except farmers):
Here: 9.2% town: 6.7%
- Percentage of females in computer and mathematical occupations:
Here: 1.1% town: 2.5%
- Percentage of females in architecture and engineering occupations:
Here: 3.8% town: 1.8%
- Percentage of females in life, physical, and social science occupations:
Here: 3.3% town: 3.3%
- Percentage of females in community and social services occupations:
Here: 7.0% town: 3.4%
- Percentage of females in education, training, and library occupations:
Here: 23.1% town: 26.2%
- Percentage of females in arts, design, entertainment, sports, and media occupations:
Here: 25.6% town: 3.4%
- Percentage of females in healthcare practitioners and technical occupations:
Here: 3.1% town: 4.9%
- Percentage of females in service occupations:
Here: 19.3% town: 17.8%
- Percentage of females in sales and office occupations:
Here: 9.2% town: 23.8%
- Percentage of females in farming, fishing, and forestry occupations:
Here: 2.8% town: 0.1%
- Percentage of females in construction, extraction, and maintenance occupations:
Here: 4.0% town: 0.1%
- Percentage of females in production occupations:
Here: 2.3% town: 2.0%
- Percentage of females in transportation occupations:
Here: 1.2% town: 0.4%
Education in this neighborhood (subdivision or community):
- Percentage of people 3 years and older in K-12 schools:
Murphy: 9.8% Blacksburg: 6.9%
- Percentage of people 3 years and older in undergraduate colleges:
Murphy: 44.1% Blacksburg: 52.6%
- Percentage of people 3 years and older in grad. or professional schools:
Murphy: 1.5% Blacksburg: 6.2%
- Percentage of students K-12 enrolled in private schools:
Murphy: 0.0% Blacksburg: 6.7%
Percentage of population below poverty level:
| Murphy: | 30.3% |
| Blacksburg: | 45.1% |
Median year owner moved in (as recorded in 2022):
Median year renter moved in (as recorded in 2022):
| Murphy: | 2007 |
| Blacksburg: | 2008 |
Median year renter moved in (as recorded in 2022):
| Murphy: | 2019 |
| Blacksburg: | 2019 |
Percentage of married-couple families with both working:
| Murphy: | 91.6% |
| Blacksburg: | 63.5% |

- 64.2%Electricity
- 13.4%Fuel oil, kerosene, etc.
- 11.6%Utility gas
- 6.4%Bottled, tank, or LP gas
- 2.4%Solar energy
- 1.9%Wood
Roads and streets:
Murphy St
Length: 0.32 miles
Directions: E-W, SE-NW, SW-NE
Address range: 300 to 417
Directions: E-W, SE-NW, SW-NE
Address range: 300 to 417
Hoyt St
Length: 0.24 miles
Directions: E-W, N-S, SE-NW, SW-NE
Address range: 1500 to 1699
Directions: E-W, N-S, SE-NW, SW-NE
Address range: 1500 to 1699
Price St
Length: 0.24 miles
Directions: N-S, SE-NW
Address range: 201 to 298
Directions: N-S, SE-NW
Address range: 201 to 298
Georgia St
Length: 0.17 miles
Directions: E-W, SW-NE
Address range: 401 to 415
Directions: E-W, SW-NE
Address range: 401 to 415
Bradley Ln
Length: 0.14 miles
Directions: E-W, SE-NW
Directions: E-W, SE-NW
North Dr
Length: 0.08 miles
Direction: E-W
Address range: 900 to 999
Direction: E-W
Address range: 900 to 999
Nelson St
Length: 0.06 miles
Directions: N-S, SE-NW, SW-NE
Address range: 1500 to 1507
Directions: N-S, SE-NW, SW-NE
Address range: 1500 to 1507
Neil St
Length: 0.04 miles
Directions: E-W, SE-NW
Address range: 300 to 311
Directions: E-W, SE-NW
Address range: 300 to 311
Other features:
Indian Run
Length: 0.22 miles
Directions: E-W, N-S, SE-NW
Directions: E-W, N-S, SE-NW