Mulford Gardens neighborhood in San Leandro, California (CA), 94577 detailed profile
Settings
X


Business Search - 14 Million verified businesses
Area: 0.473 square miles
Population: 1,638
Population density:
| Mulford Gardens: | 3,462 people per square mile |
| San Leandro: | 6,610 people per square mile |

- 72244.1%Hispanic or Latino
- 34821.2%Asian
- 31519.2%White
- 1177.1%Native Hawaiian and Other
Pacific Islander - 1046.3%Two or more races
- 332.0%Black

Distribution of median household income
![Distribution of median household income]()
- 19Less than $10,000
- 28$10,000 to $19,999
- 59$20,000 to $29,999
- 20$30,000 to $39,999
- 78$40,000 to $49,999
- 11$50,000 to $59,999
- 59$60,000 to $74,999
- 33$75,000 to $99,999
- 39$100,000 to $124,999
- 50$125,000 to $149,999
- 39$150,000 to $199,999
- 89$200,000 or more

Distribution of owner-occupied house/condo value
![Distribution of owner-occupied house/condo value]()
- 38Less than $50,000
- 14$50,000 to $99,999
- 11$100,000 to $149,999
- 20$150,000 to $199,999
- 10$200,000 to $249,999
- 41$250,000 to $299,999
- 11$300,000 to $399,999
- 7$400,000 to $499,999
- 60$500,000 to $749,999
- 59$750,000 to $999,999
- 54$1,000,000 or more

Distribution of rent paid by renters
![Distribution of rent paid by renters]()
- 7$900 to $999
- 18$1,250 to $1,499
- 106$1,500 to $1,999
- 132$2,000 or more

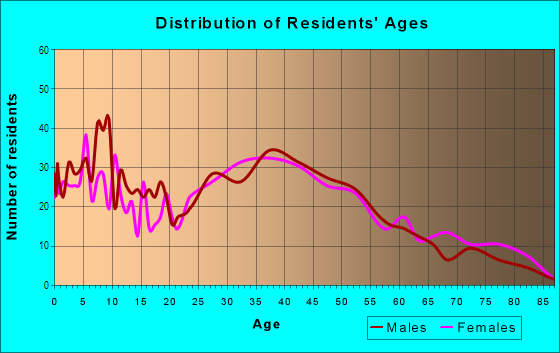
| Males: | 790 |
| Females: | 847 |
Males:
| This neighborhood: | 38.8 years |
| Whole city: | 40.3 years |
| This neighborhood: | 37.1 years |
| Whole city: | 45.2 years |
Average household size:
| Mulford Gardens: | 3.6 people |
| San Leandro: | 2.9 people |
Percentage of family households:
| Mulford Gardens: | 61.6% |
| San Leandro: | 44.4% |
| Here: | 47.6% |
| San Leandro: | 49.6% |
Percentage of married-couple families with children (among all households):
| Mulford Gardens: | 19.2% |
| San Leandro: | 26.2% |
Percentage of single-mother households (among all households):
| Mulford Gardens: | 11.0% |
| San Leandro: | 7.1% |
Percentage of never married males 15 years old and over:
Percentage of never married females 15 years old and over:
| Mulford Gardens: | 24.5% |
| San Leandro: | 18.2% |
Percentage of never married females 15 years old and over:
| Mulford Gardens: | 20.8% |
| city: | 16.0% |
Percentage of people that speak English not well or not at all:
| Mulford Gardens: | 5.1% |
| San Leandro: | 12.0% |
Percentage of people born in this state:
Percentage of people born in another U.S. state:
Percentage of native residents but born outside the U.S.:
Percentage of foreign born residents:
| Here: | 53.4% |
| San Leandro: | 44.1% |
Percentage of people born in another U.S. state:
| Mulford Gardens: | 5.2% |
| San Leandro: | 9.8% |
Percentage of native residents but born outside the U.S.:
| Here: | 1.6% |
| city: | 1.7% |
Percentage of foreign born residents:
| Here: | 39.8% |
| San Leandro: | 44.4% |

Owner-occupied
Renter-occupied


- Rooms in owner-occupied houses and condos in Mulford Gardens
- 81 room
- 02 rooms
- 123 rooms
- 324 rooms
- 765 rooms
- 306 rooms
- 287 rooms
- 488 rooms
- 69+ rooms

- Rooms in renter-occupied apartments in Mulford Gardens
- 471 room
- 222 rooms
- 603 rooms
- 394 rooms
- 175 rooms
- 626 rooms
- 277 rooms
- 238 rooms
- 09+ rooms
Owner-occupied
Renter-occupied

- Bedrooms in owner-occupied houses and condos in Mulford Gardens
- 8no bedroom
- 31 bedroom
- 702 bedrooms
- 1463 bedrooms
- 174 bedrooms
- 65+ bedrooms

- Bedrooms in renter-occupied apartments in Mulford Gardens
- 47no bedroom
- 411 bedroom
- 852 bedrooms
- 633 bedrooms
- 104 bedrooms
- 105+ bedrooms
Average number of cars or other vehicles available in houses/condos:
Average number of cars or other vehicles available in apartments:
| This neighborhood: | 2.7 |
| San Leandro: | 2.2 |
Average number of cars or other vehicles available in apartments:
| Here: | 1.8 |
| city: | 1.3 |
Percentage of units with a mortgage:
| Mulford Gardens: | 86.2% |
| San Leandro: | 63.4% |
Average estimated value of detached houses in 2022 (59.6% of all units):
| Mulford Gardens: | $669,843 |
| California: | $988,808 |

- Year house built in Mulford Gardens
- 02020 or later
- 302010 to 2019
- 162000 to 2009
- 241990 to 1999
- 101980 to 1989
- 591970 to 1979
- 571960 to 1969
- 1251950 to 1959
- 861940 to 1949
- 1071939 or earlier

City-data.com crime index for city in 2020 (higher means more crime):
| City: | 374.8 |
| U.S. average: | 219.5 |
Travel time to work (commute)
![Travel time to work (commute)]()
- 15Less than 5 minutes
- 615 to 9 minutes
- 10310 to 14 minutes
- 12515 to 19 minutes
- 8020 to 24 minutes
- 2425 to 29 minutes
- 13530 to 34 minutes
- 735 to 39 minutes
- 840 to 44 minutes
- 9245 to 59 minutes
- 8260 to 89 minutes
- 1490 or more minutes

Means of transportation to work
![Means of transportation to work]()
- 79.4%645Drove a car alone
- 6.5%53Carpooled
- 6.8%55Bus
- 1.7%14Subway or elevated rail
- 2.1%17Long-distance train or commuter rail
- 0.9%7Ferryboat
- 3.6%29Motorcycle
- 1.2%10Bicycle
- 0.9%7Walked
- 2.1%17Other means
- 3.8%31Worked at home

Time leaving home to go to work
![Time leaving home to go to work]()
- 6612:00 a.m. to 4:59 a.m.
- 545:00 a.m. to 5:29 a.m.
- 75:30 a.m. to 5:59 a.m.
- 406:00 a.m. to 6:29 a.m.
- 466:30 a.m. to 6:59 a.m.
- 1087:00 a.m. to 7:29 a.m.
- 707:30 a.m. to 7:59 a.m.
- 718:00 a.m. to 8:29 a.m.
- 298:30 a.m. to 8:59 a.m.
- 609:00 a.m. to 9:59 a.m.
- 3910:00 a.m. to 10:59 a.m.
- 211:00 a.m. to 11:59 a.m.
- 4912:00 p.m. to 3:59 p.m.
- 724:00 p.m. to 11:59 p.m.

Occupations of males:
- Percentage of males in management occupations (except farmers):
Here: 8.7% city: 9.9%
- Percentage of males in business and financial operations occupations:
Here: 5.5% city: 4.3%
- Percentage of males in computer and mathematical occupations:
Here: 1.9% city: 6.7%
- Percentage of males in architecture and engineering occupations:
Here: 9.0% city: 3.6%
- Percentage of males in education, training, and library occupations:
Here: 6.6% city: 3.0%
- Percentage of males in service occupations:
Here: 22.3% city: 14.6%
- Percentage of males in sales and office occupations:
Here: 19.0% city: 14.8%
- Percentage of males in construction, extraction, and maintenance occupations:
Here: 7.7% city: 10.0%
- Percentage of males in production occupations:
Here: 5.1% city: 7.8%
- Percentage of males in transportation occupations:
Here: 5.0% city: 7.3%
- Percentage of males in material moving occupations:
Here: 3.1% city: 6.8%
Occupations of females:
- Percentage of females in management occupations (except farmers):
Here: 10.4% city: 9.2%
- Percentage of females in business and financial operations occupations:
Here: 18.8% city: 7.3%
- Percentage of females in computer and mathematical occupations:
Here: 2.5% city: 2.3%
- Percentage of females in education, training, and library occupations:
Here: 5.7% city: 6.9%
- Percentage of females in arts, design, entertainment, sports, and media occupations:
Here: 2.6% city: 2.2%
- Percentage of females in healthcare practitioners and technical occupations:
Here: 4.2% city: 6.5%
- Percentage of females in service occupations:
Here: 26.5% city: 23.3%
- Percentage of females in sales and office occupations:
Here: 25.7% city: 26.6%
- Percentage of females in production occupations:
Here: 2.9% city: 5.3%
Education in this neighborhood (subdivision or community):
- Percentage of people 3 years and older in K-12 schools:
Mulford Gardens: 19.7% San Leandro: 14.4%
- Percentage of people 3 years and older in undergraduate colleges:
Mulford Gardens: 8.6% San Leandro: 5.5%
- Percentage of people 3 years and older in grad. or professional schools:
Mulford Gardens: 1.0% San Leandro: 1.6%
- Percentage of students K-12 enrolled in private schools:
Mulford Gardens: 15.6% San Leandro: 9.9%
Percentage of population below poverty level:
| Mulford Gardens: | 7.4% |
| San Leandro: | 7.4% |
Median year owner moved in (as recorded in 2022):
| Mulford Gardens: | 2003 |
| San Leandro: | 2006 |
Percentage of married-couple families with both working:
| Mulford Gardens: | 77.7% |
| San Leandro: | 62.2% |

- 53.9%Utility gas
- 34.6%Electricity
- 4.5%No fuel used
- 2.9%Bottled, tank, or LP gas
- 2.4%Solar energy
- 1.7%Fuel oil, kerosene, etc.
Roads and streets:
Fairway Dr
Length: 1.59 miles
Directions: E-W, SW-NE
Address range: 2000 to 2599
Directions: E-W, SW-NE
Address range: 2000 to 2599
Doolittle Dr
Length: 1.39 miles
Direction: SE-NW
Address range: 1796 to 13699
Direction: SE-NW
Address range: 1796 to 13699
Marina Blvd
Length: 1.20 miles
Directions: E-W, SW-NE
Address range: 2014 to 2899
Directions: E-W, SW-NE
Address range: 2014 to 2899
W Ave 133rd
Length: 0.83 miles
Direction: SW-NE
Address range: 2000 to 2699
Direction: SW-NE
Address range: 2000 to 2699
W Ave 134th
Length: 0.75 miles
Directions: E-W, SW-NE
Address range: 2000 to 2699
Directions: E-W, SW-NE
Address range: 2000 to 2699
Aurora Dr
Length: 0.69 miles
Direction: SE-NW
Address range: 12900 to 13699
Direction: SE-NW
Address range: 12900 to 13699
Williams St
Length: 0.58 miles
Directions: E-W, SW-NE
Address range: 2200 to 2699
Directions: E-W, SW-NE
Address range: 2200 to 2699
W Ave 136th
Length: 0.58 miles
Directions: E-W, SW-NE
Address range: 2000 to 2499
Directions: E-W, SW-NE
Address range: 2000 to 2499
W Ave 135th
Length: 0.58 miles
Directions: E-W, SW-NE
Address range: 2000 to 2499
Directions: E-W, SW-NE
Address range: 2000 to 2499
Menlo St
Length: 0.41 miles
Direction: SE-NW
Address range: 13200 to 13699
Direction: SE-NW
Address range: 13200 to 13699
Sitka St
Length: 0.39 miles
Directions: E-W, SW-NE
Address range: 1900 to 2499
Directions: E-W, SW-NE
Address range: 1900 to 2499
Neptune Dr
Length: 0.34 miles
Directions: N-S, SE-NW, SW-NE
Address range: 12962 to 13229
Directions: N-S, SE-NW, SW-NE
Address range: 12962 to 13229
Nome St
Length: 0.34 miles
Direction: SE-NW
Address range: 1800 to 2199
Direction: SE-NW
Address range: 1800 to 2199
W Ave 130th
Length: 0.22 miles
Directions: E-W, SW-NE
Address range: 2500 to 2699
Directions: E-W, SW-NE
Address range: 2500 to 2699
Arctic St
Length: 0.19 miles
Direction: SE-NW
Address range: 1900 to 2199
Direction: SE-NW
Address range: 1900 to 2199
Barrow St
Length: 0.18 miles
Directions: E-W, SW-NE
Address range: 2200 to 2399
Directions: E-W, SW-NE
Address range: 2200 to 2399
Juneau St
Length: 0.18 miles
Direction: SE-NW
Address range: 1900 to 2199
Direction: SE-NW
Address range: 1900 to 2199
Fairbanks St
Length: 0.18 miles
Direction: SE-NW
Address range: 1900 to 2199
Direction: SE-NW
Address range: 1900 to 2199
State St
Length: 0.14 miles
Direction: E-W
Address range: 2400 to 2499
Direction: E-W
Address range: 2400 to 2499
Yukon St
Length: 0.10 miles
Directions: E-W, SE-NW, SW-NE
Address range: 2300 to 2399
Directions: E-W, SE-NW, SW-NE
Address range: 2300 to 2399
Walnut Dr
Length: 0.08 miles
Direction: SW-NE
Address range: 2500 to 2699
Direction: SW-NE
Address range: 2500 to 2699
Marina Ct
Length: 0.06 miles
Direction: SE-NW
Address range: 2000 to 2099
Direction: SE-NW
Address range: 2000 to 2099
Railroad features:
Union Pacific RR
Length: 0.07 miles
Direction: SE-NW
Direction: SE-NW