Mount Vernon Triangle neighborhood in Washington, District of Columbia (DC), 20001 detailed profile
Settings
X

Business Search - 14 Million verified businesses
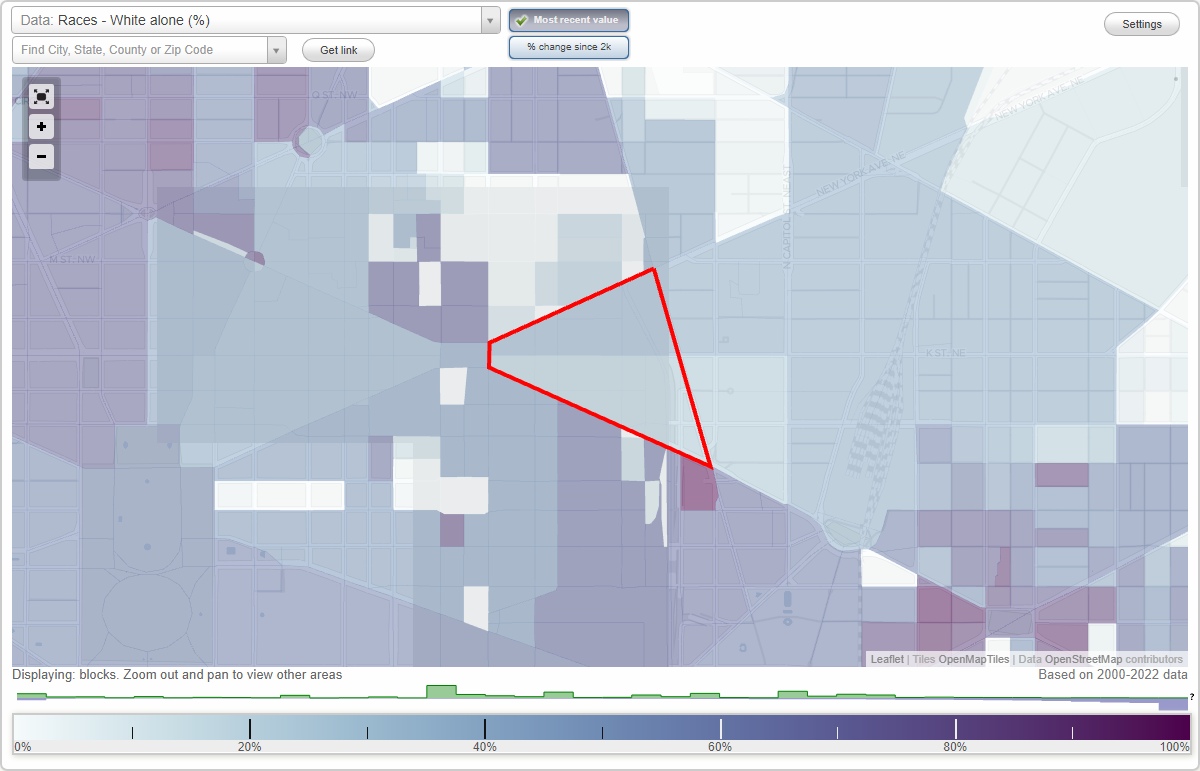
Area: 0.112 square miles
Population: 2,251
Population density:
| Mount Vernon Triangle: | 20,020 people per square mile |
| Washington: | 10,941 people per square mile |

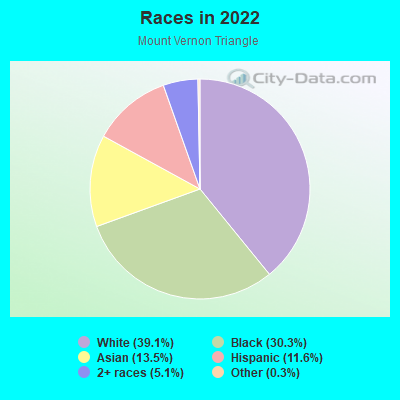
- 89139.1%White
- 68930.3%Black
- 30813.5%Asian
- 26411.6%Hispanic or Latino
- 1175.1%Two or more races
- 70.3%Some other race
Median household income in 2022:
| Mount Vernon Triangle: | $114,333 |
| Washington: | $101,027 |
Distribution of median household income
![Distribution of median household income]()
- 76Less than $10,000
- 116$10,000 to $19,999
- 59$20,000 to $29,999
- 21$30,000 to $39,999
- 113$40,000 to $49,999
- 61$50,000 to $59,999
- 55$60,000 to $74,999
- 96$75,000 to $99,999
- 88$100,000 to $124,999
- 195$125,000 to $149,999
- 178$150,000 to $199,999
- 333$200,000 or more

Distribution of owner-occupied house/condo value
![Distribution of owner-occupied house/condo value]()
- 31$300,000 to $399,999
- 57$400,000 to $499,999
- 239$500,000 to $749,999
- 214$750,000 to $999,999
- 99$1,000,000 or more

Distribution of rent paid by renters
![Distribution of rent paid by renters]()
- 138$100 to $199
- 168$200 to $299
- 22$300 to $399
- 79$400 to $499
- 47$500 to $599
- 134$600 to $699
- 180$700 to $799
- 47$800 to $899
- 167$900 to $999
- 55$1,000 to $1,249
- 43$1,250 to $1,499
- 76$1,500 to $1,999
- 554$2,000 or more

Median rent in 2022:
| Mount Vernon Triangle: | $2,133 |
| Washington: | $1,768 |
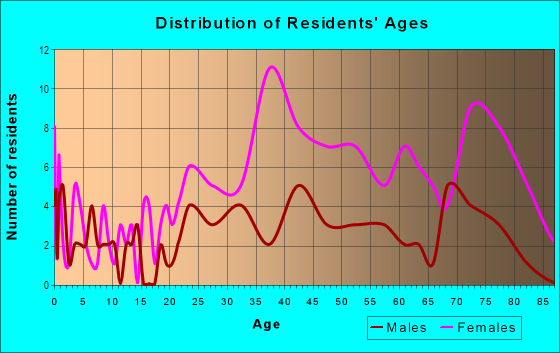
| Males: | 1,330 |
| Females: | 920 |
Males:
| This neighborhood: | 34.5 years |
| Whole city: | 34.8 years |
| This neighborhood: | 36.3 years |
| Whole city: | 34.9 years |
Average household size:
| Mount Vernon Triangle: | 1.6 people |
| Washington: | 1.9 people |
Percentage of family households:
| Mount Vernon Triangle: | 30.3% |
| Washington: | 28.7% |
| Here: | 24.2% |
| Washington: | 23.7% |
Percentage of married-couple families with children (among all households):
| Mount Vernon Triangle: | 24.1% |
| Washington: | 27.5% |
Percentage of single-mother households (among all households):
| Mount Vernon Triangle: | 29.9% |
| Washington: | 19.2% |
Percentage of never married males 15 years old and over:
Percentage of never married females 15 years old and over:
| Mount Vernon Triangle: | 34.2% |
| Washington: | 26.6% |
Percentage of never married females 15 years old and over:
| Mount Vernon Triangle: | 23.3% |
| city: | 29.3% |
Percentage of people that speak English not well or not at all:
| Mount Vernon Triangle: | 2.3% |
| Washington: | 2.1% |
Percentage of people born in this state:
Percentage of people born in another U.S. state:
Percentage of native residents but born outside the U.S.:
Percentage of foreign born residents:
| Here: | 35.0% |
| Washington: | 33.9% |
Percentage of people born in another U.S. state:
| Mount Vernon Triangle: | 46.3% |
| Washington: | 49.2% |
Percentage of native residents but born outside the U.S.:
| Here: | 7.3% |
| city: | 2.1% |
Percentage of foreign born residents:
| Here: | 11.4% |
| Washington: | 14.9% |
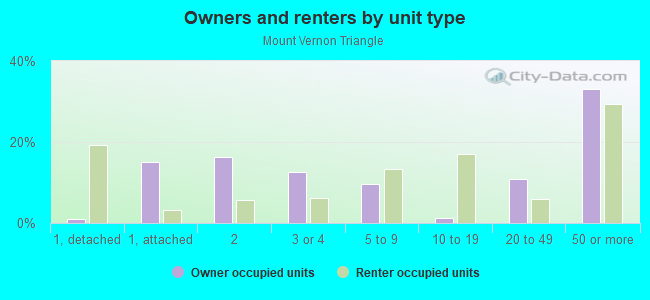
Owner-occupied
Renter-occupied

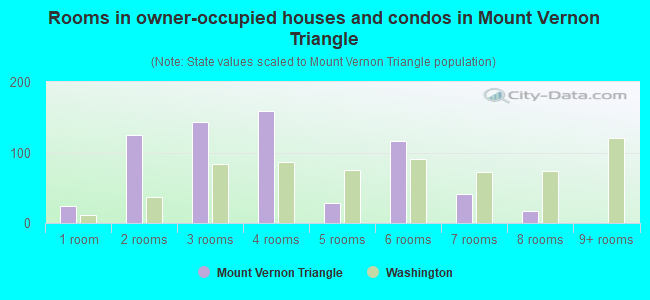
- Rooms in owner-occupied houses and condos in Mount Vernon Triangle
- 241 room
- 1252 rooms
- 1433 rooms
- 1594 rooms
- 285 rooms
- 1176 rooms
- 417 rooms
- 178 rooms
- 09+ rooms
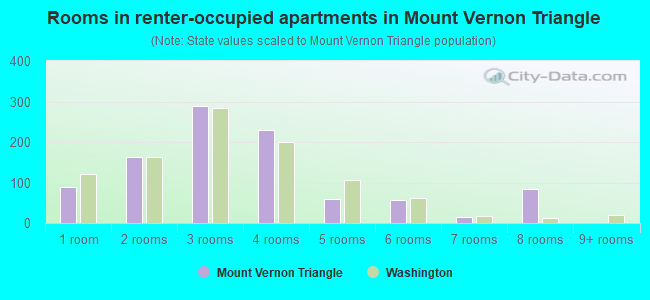
- Rooms in renter-occupied apartments in Mount Vernon Triangle
- 901 room
- 1642 rooms
- 2883 rooms
- 2294 rooms
- 595 rooms
- 576 rooms
- 167 rooms
- 848 rooms
- 09+ rooms
Owner-occupied
Renter-occupied
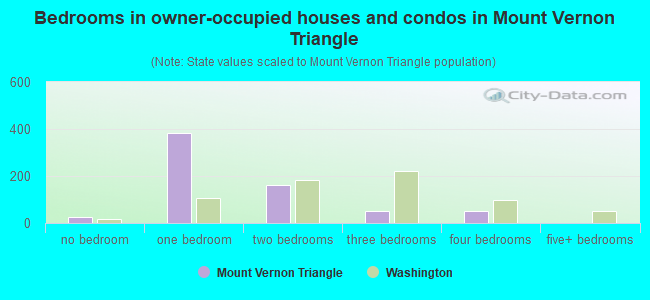
- Bedrooms in owner-occupied houses and condos in Mount Vernon Triangle
- 24no bedroom
- 3831 bedroom
- 1602 bedrooms
- 513 bedrooms
- 524 bedrooms
- 05+ bedrooms
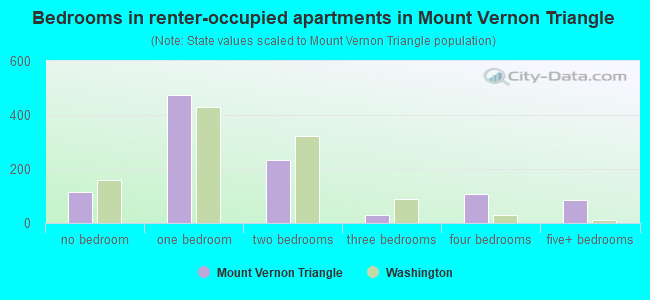
- Bedrooms in renter-occupied apartments in Mount Vernon Triangle
- 116no bedroom
- 4741 bedroom
- 2342 bedrooms
- 283 bedrooms
- 1094 bedrooms
- 845+ bedrooms
Average number of cars or other vehicles available in houses/condos:
Average number of cars or other vehicles available in apartments:
| This neighborhood: | |
| Washington: |
Average number of cars or other vehicles available in apartments:
| Here: | 0.6 |
| city: | 0.7 |
Percentage of units with a mortgage:
| Mount Vernon Triangle: | 83.1% |
| Washington: | 73.9% |
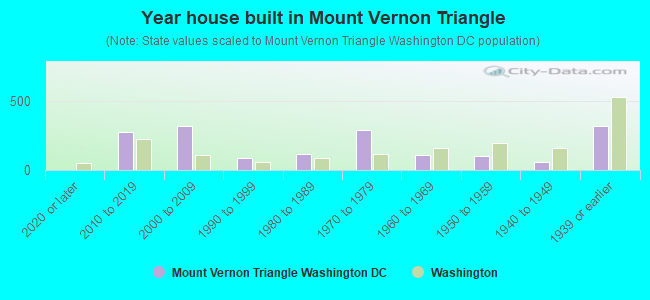
- Year house built in Mount Vernon Triangle
- 02020 or later
- 2712010 to 2019
- 3172000 to 2009
- 861990 to 1999
- 1131980 to 1989
- 2921970 to 1979
- 1051960 to 1969
- 1041950 to 1959
- 601940 to 1949
- 3201939 or earlier
City-data.com crime index for city in 2020 (higher means more crime):
| City: | 462.8 |
| U.S. average: | 219.5 |
Travel time to work (commute)
![Travel time to work (commute)]()
- 2Less than 5 minutes
- 205 to 9 minutes
- 15410 to 14 minutes
- 26515 to 19 minutes
- 13820 to 24 minutes
- 4225 to 29 minutes
- 15030 to 34 minutes
- 6035 to 39 minutes
- 3440 to 44 minutes
- 6745 to 59 minutes
- 6260 to 89 minutes
- 190 or more minutes

Means of transportation to work
![Means of transportation to work]()
- 23.2%377Drove a car alone
- 2.2%36Carpooled
- 4.3%70Bus
- 12.0%195Subway or elevated rail
- 0.7%12Long-distance train or commuter rail
- 2.3%37Taxi
- 3.3%53Bicycle
- 25.1%408Walked
- 1.2%20Other means
- 28.2%459Worked at home

Time leaving home to go to work
![Time leaving home to go to work]()
- 1112:00 a.m. to 4:59 a.m.
- 25:30 a.m. to 5:59 a.m.
- 156:00 a.m. to 6:29 a.m.
- 646:30 a.m. to 6:59 a.m.
- 1327:00 a.m. to 7:29 a.m.
- 1607:30 a.m. to 7:59 a.m.
- 1488:00 a.m. to 8:29 a.m.
- 1408:30 a.m. to 8:59 a.m.
- 1229:00 a.m. to 9:59 a.m.
- 3510:00 a.m. to 10:59 a.m.
- 2511:00 a.m. to 11:59 a.m.
- 4212:00 p.m. to 3:59 p.m.
- 944:00 p.m. to 11:59 p.m.

Occupations of males:
- Percentage of males in management occupations (except farmers):
Here: 34.7% city: 18.3%
- Percentage of males in business and financial operations occupations:
Here: 12.8% city: 11.0%
- Percentage of males in computer and mathematical occupations:
Here: 10.4% city: 9.5%
- Percentage of males in architecture and engineering occupations:
Here: 1.6% city: 2.5%
- Percentage of males in life, physical, and social science occupations:
Here: 3.4% city: 4.1%
- Percentage of males in community and social services occupations:
Here: 3.2% city: 1.6%
- Percentage of males in legal occupations:
Here: 6.9% city: 8.0%
- Percentage of males in education, training, and library occupations:
Here: 1.2% city: 4.3%
- Percentage of males in arts, design, entertainment, sports, and media occupations:
Here: 7.2% city: 5.8%
- Percentage of males in healthcare practitioners and technical occupations:
Here: 1.1% city: 2.7%
- Percentage of males in service occupations:
Here: 5.1% city: 10.8%
- Percentage of males in sales and office occupations:
Here: 8.1% city: 11.5%
Occupations of females:
- Percentage of females in management occupations (except farmers):
Here: 14.3% city: 17.1%
- Percentage of females in business and financial operations occupations:
Here: 22.4% city: 13.7%
- Percentage of females in computer and mathematical occupations:
Here: 2.8% city: 5.1%
- Percentage of females in life, physical, and social science occupations:
Here: 2.7% city: 4.0%
- Percentage of females in community and social services occupations:
Here: 3.8% city: 2.8%
- Percentage of females in legal occupations:
Here: 11.6% city: 8.7%
- Percentage of females in education, training, and library occupations:
Here: 3.5% city: 8.0%
- Percentage of females in arts, design, entertainment, sports, and media occupations:
Here: 3.4% city: 5.9%
- Percentage of females in healthcare practitioners and technical occupations:
Here: 9.1% city: 4.9%
- Percentage of females in service occupations:
Here: 10.4% city: 13.0%
- Percentage of females in sales and office occupations:
Here: 14.7% city: 14.3%
Percentage of people 16-64 in Armed Forces:
| Mount Vernon Triangle: | 0.4% |
| Washington: | 1.1% |
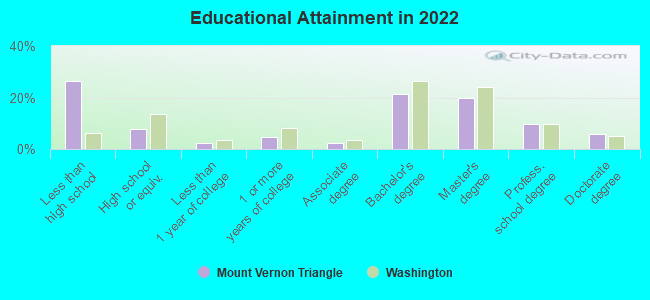
Education in this neighborhood (subdivision or community):
- Percentage of people 3 years and older in K-12 schools:
Mount Vernon Triangle: 30.5% Washington: 13.4%
- Percentage of people 3 years and older in undergraduate colleges:
Mount Vernon Triangle: 3.4% Washington: 6.4%
- Percentage of people 3 years and older in grad. or professional schools:
Mount Vernon Triangle: 5.3% Washington: 3.9%
- Percentage of students K-12 enrolled in private schools:
Mount Vernon Triangle: 0.0% Washington: 21.4%
Percentage of population below poverty level:
| Mount Vernon Triangle: | 11.6% |
| Washington: | 13.3% |
Median year renter moved in (as recorded in 2022):
| Mount Vernon Triangle: | 2017 |
| Washington: | 2020 |
Percentage of married-couple families with both working:
| Mount Vernon Triangle: | 100.0% |
| Washington: | 82.1% |
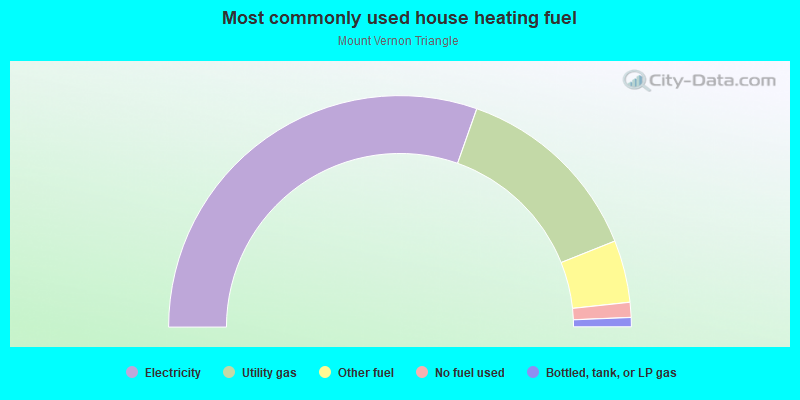
- 60.8%Electricity
- 27.1%Utility gas
- 8.7%Other fuel
- 2.1%No fuel used
- 1.3%Bottled, tank, or LP gas
Limited-access highways (interstate or state) in this neighborhood:
Dwight D Eisenhower Fwy (I- 395)
Length: 0.61 miles
Directions: N-S, SE-NW
Directions: N-S, SE-NW
Highways in this neighborhood:
US Hwy 1 (US Hwy 50, 6th St NW)
Length: 0.07 miles
Direction: N-S
Address range: 901 to 999
Direction: N-S
Address range: 901 to 999
Roads and streets:
Massachusetts Ave NW
Length: 0.55 miles
Direction: E-W
Address range: 100 to 599
Direction: E-W
Address range: 100 to 599
New Jersey Ave NW
Length: 0.43 miles
Directions: N-S, SE-NW
Address range: 700 to 1136
Directions: N-S, SE-NW
Address range: 700 to 1136
K St NW
Length: 0.43 miles
Direction: E-W
Address range: 200 to 599
Direction: E-W
Address range: 200 to 599
I St NW
Length: 0.32 miles
Direction: E-W
Address range: 120 to 499
Direction: E-W
Address range: 120 to 499
H St NW
Length: 0.26 miles
Directions: E-W, SW-NE
Address range: 108 to 299
Directions: E-W, SW-NE
Address range: 108 to 299
4th St NW
Length: 0.25 miles
Direction: N-S
Address range: 800 to 1098
Direction: N-S
Address range: 800 to 1098
2nd St NW
Length: 0.19 miles
Direction: N-S
Address range: 722 to 999
Direction: N-S
Address range: 722 to 999
L St NW
Length: 0.19 miles
Direction: E-W
Address range: 400 to 499
Direction: E-W
Address range: 400 to 499
3rd St NW
Length: 0.19 miles
Direction: N-S
Address range: 800 to 999
Direction: N-S
Address range: 800 to 999
5th St NW
Length: 0.18 miles
Direction: N-S
Address range: 900 to 1062
Direction: N-S
Address range: 900 to 1062
Prather Ct NW
Length: 0.10 miles
Direction: E-W
Address range: 400 to 499
Direction: E-W
Address range: 400 to 499