Moss Bradley neighborhood in Peoria, Illinois (IL), 61606 detailed profile
Settings
X


Business Search - 14 Million verified businesses
Area: 0.382 square miles
Population: 2,933
Population density:
| Moss Bradley: | 7,686 people per square mile |
| Peoria: | 2,460 people per square mile |

- 2,13372.6%White
- 43714.9%Black
- 2077.0%Hispanic or Latino
- 893.0%Asian
- 722.5%Two or more races

Distribution of median household income
![Distribution of median household income]()
- 223Less than $10,000
- 242$10,000 to $19,999
- 56$20,000 to $29,999
- 161$30,000 to $39,999
- 115$40,000 to $49,999
- 88$50,000 to $59,999
- 98$60,000 to $74,999
- 59$75,000 to $99,999
- 115$100,000 to $124,999
- 75$125,000 to $149,999
- 46$150,000 to $199,999
- 74$200,000 or more

Distribution of owner-occupied house/condo value
![Distribution of owner-occupied house/condo value]()
- 166Less than $50,000
- 298$50,000 to $99,999
- 82$100,000 to $149,999
- 106$150,000 to $199,999
- 36$200,000 to $249,999
- 30$250,000 to $299,999
- 25$300,000 to $399,999
- 20$400,000 to $499,999
- 17$500,000 to $749,999

Distribution of rent paid by renters
![Distribution of rent paid by renters]()
- 22Less than $100
- 58$100 to $199
- 51$200 to $299
- 122$300 to $399
- 128$400 to $499
- 126$500 to $599
- 250$600 to $699
- 199$700 to $799
- 90$800 to $899
- 51$900 to $999
- 95$1,000 to $1,249
- 17$1,250 to $1,499
- 57$1,500 to $1,999

Median rent in 2022:
| Moss Bradley: | $719 |
| Peoria: | $696 |
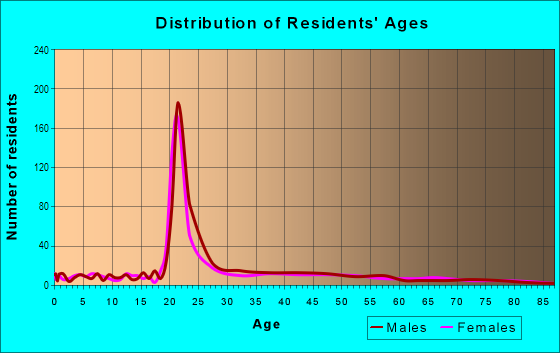
| Males: | 1,557 |
| Females: | 1,376 |
Males:
| This neighborhood: | 25.9 years |
| Whole city: | 33.8 years |
| This neighborhood: | 27.8 years |
| Whole city: | 36.0 years |
Average household size:
| Moss Bradley: | 2.2 people |
| Peoria: | 2.2 people |
Percentage of family households:
| Moss Bradley: | 21.6% |
| Peoria: | 41.0% |
| Here: | 24.0% |
| Peoria: | 33.8% |
Percentage of married-couple families with children (among all households):
| Moss Bradley: | 34.5% |
| Peoria: | 22.1% |
Percentage of single-mother households (among all households):
| Moss Bradley: | 6.9% |
| Peoria: | 16.8% |
Percentage of never married males 15 years old and over:
Percentage of never married females 15 years old and over:
| Moss Bradley: | 38.8% |
| Peoria: | 19.6% |
Percentage of never married females 15 years old and over:
| Moss Bradley: | 30.9% |
| city: | 19.0% |
Percentage of people that speak English not well or not at all:
| Moss Bradley: | 0.8% |
| Peoria: | 1.6% |
Percentage of people born in this state:
Percentage of people born in another U.S. state:
Percentage of native residents but born outside the U.S.:
Percentage of foreign born residents:
| Here: | 70.4% |
| Peoria: | 72.0% |
Percentage of people born in another U.S. state:
| Moss Bradley: | 23.6% |
| Peoria: | 18.8% |
Percentage of native residents but born outside the U.S.:
| Here: | 1.6% |
| city: | 1.4% |
Percentage of foreign born residents:
| Here: | 4.5% |
| Peoria: | 7.8% |

Owner-occupied
Renter-occupied


- Rooms in owner-occupied houses and condos in Moss Bradley
- 101 room
- 02 rooms
- 93 rooms
- 244 rooms
- 325 rooms
- 326 rooms
- 907 rooms
- 1148 rooms
- 2029+ rooms

- Rooms in renter-occupied apartments in Moss Bradley
- 251 room
- 1102 rooms
- 1493 rooms
- 1414 rooms
- 1765 rooms
- 1066 rooms
- 567 rooms
- 868 rooms
- 409+ rooms
Owner-occupied
Renter-occupied

- Bedrooms in owner-occupied houses and condos in Moss Bradley
- 10no bedroom
- 91 bedroom
- 852 bedrooms
- 1343 bedrooms
- 984 bedrooms
- 815+ bedrooms

- Bedrooms in renter-occupied apartments in Moss Bradley
- 26no bedroom
- 3271 bedroom
- 1462 bedrooms
- 2293 bedrooms
- 844 bedrooms
- 485+ bedrooms
Average number of cars or other vehicles available in houses/condos:
Average number of cars or other vehicles available in apartments:
| This neighborhood: | 2.0 |
| Peoria: | 1.8 |
Average number of cars or other vehicles available in apartments:
| Here: | 1.3 |
| city: | 1.1 |
Percentage of units with a mortgage:
| Moss Bradley: | 71.7% |
| Peoria: | 63.0% |

- Year house built in Moss Bradley
- 02020 or later
- 442010 to 2019
- 1262000 to 2009
- 791990 to 1999
- 751980 to 1989
- 1031970 to 1979
- 561960 to 1969
- 1171950 to 1959
- 431940 to 1949
- 9211939 or earlier

City-data.com crime index for city in 2020 (higher means more crime):
| City: | 443.5 |
| U.S. average: | 219.5 |
Travel time to work (commute)
![Travel time to work (commute)]()
- 119Less than 5 minutes
- 2545 to 9 minutes
- 45410 to 14 minutes
- 16215 to 19 minutes
- 18120 to 24 minutes
- 3825 to 29 minutes
- 9130 to 34 minutes
- 1235 to 39 minutes
- 1045 to 59 minutes
- 2160 to 89 minutes
- 4490 or more minutes

Means of transportation to work
![Means of transportation to work]()
- 64.1%1,007Drove a car alone
- 9.9%156Carpooled
- 1.0%15Bus
- 1.8%28Bicycle
- 15.2%239Walked
- 10.6%167Worked at home

Time leaving home to go to work
![Time leaving home to go to work]()
- 12512:00 a.m. to 4:59 a.m.
- 365:00 a.m. to 5:29 a.m.
- 835:30 a.m. to 5:59 a.m.
- 206:00 a.m. to 6:29 a.m.
- 866:30 a.m. to 6:59 a.m.
- 667:00 a.m. to 7:29 a.m.
- 1917:30 a.m. to 7:59 a.m.
- 938:00 a.m. to 8:29 a.m.
- 1158:30 a.m. to 8:59 a.m.
- 479:00 a.m. to 9:59 a.m.
- 5210:00 a.m. to 10:59 a.m.
- 1111:00 a.m. to 11:59 a.m.
- 23112:00 p.m. to 3:59 p.m.
- 2144:00 p.m. to 11:59 p.m.

Occupations of males:
- Percentage of males in management occupations (except farmers):
Here: 13.2% city: 11.1%
- Percentage of males in business and financial operations occupations:
Here: 11.0% city: 4.5%
- Percentage of males in computer and mathematical occupations:
Here: 3.1% city: 6.1%
- Percentage of males in architecture and engineering occupations:
Here: 5.1% city: 9.0%
- Percentage of males in education, training, and library occupations:
Here: 6.8% city: 3.7%
- Percentage of males in arts, design, entertainment, sports, and media occupations:
Here: 2.3% city: 1.9%
- Percentage of males in healthcare practitioners and technical occupations:
Here: 3.8% city: 4.7%
- Percentage of males in service occupations:
Here: 12.0% city: 15.9%
- Percentage of males in sales and office occupations:
Here: 17.4% city: 12.1%
- Percentage of males in farming, fishing, and forestry occupations:
Here: 6.6% city: 1.0%
- Percentage of males in production occupations:
Here: 5.8% city: 7.6%
- Percentage of males in transportation occupations:
Here: 2.6% city: 5.1%
- Percentage of males in material moving occupations:
Here: 4.8% city: 6.4%
Occupations of females:
- Percentage of females in management occupations (except farmers):
Here: 4.5% city: 8.2%
- Percentage of females in business and financial operations occupations:
Here: 1.9% city: 3.9%
- Percentage of females in life, physical, and social science occupations:
Here: 1.1% city: 1.4%
- Percentage of females in community and social services occupations:
Here: 4.6% city: 3.4%
- Percentage of females in education, training, and library occupations:
Here: 12.7% city: 9.3%
- Percentage of females in arts, design, entertainment, sports, and media occupations:
Here: 1.6% city: 1.8%
- Percentage of females in healthcare practitioners and technical occupations:
Here: 18.5% city: 14.9%
- Percentage of females in service occupations:
Here: 31.6% city: 24.2%
- Percentage of females in sales and office occupations:
Here: 20.9% city: 23.2%
- Percentage of females in material moving occupations:
Here: 1.1% city: 2.4%
Percentage of people 16-64 in Armed Forces:
| Moss Bradley: | 0.4% |
| Peoria: | 0.7% |
Education in this neighborhood (subdivision or community):
- Percentage of people 3 years and older in K-12 schools:
Moss Bradley: 11.8% Peoria: 17.8%
- Percentage of people 3 years and older in undergraduate colleges:
Moss Bradley: 34.2% Peoria: 7.5%
- Percentage of people 3 years and older in grad. or professional schools:
Moss Bradley: 4.8% Peoria: 2.5%
- Percentage of students K-12 enrolled in private schools:
Moss Bradley: 75.2% Peoria: 16.0%
Percentage of population below poverty level:
| Moss Bradley: | 32.5% |
| Peoria: | 17.4% |
Median year renter moved in (as recorded in 2022):
| Moss Bradley: | 2017 |
| Peoria: | 2020 |
Percentage of married-couple families with both working:
| Moss Bradley: | 74.3% |
| Peoria: | 71.4% |

- 50.2%Electricity
- 45.1%Utility gas
- 2.7%Bottled, tank, or LP gas
- 1.1%No fuel used
- 0.9%Other fuel
Highways in this neighborhood:
State Rte 8 (University St)
Length: 0.26 miles
Directions: E-W, N-S, SE-NW
Address range: 700 to 865
Directions: E-W, N-S, SE-NW
Address range: 700 to 865
State Rte 8 (N Bourland Ave)
Length: 0.09 miles
Direction: N-S
Address range: 800 to 917
Direction: N-S
Address range: 800 to 917
Roads and streets:
W Moss Ave
Length: 1.09 miles
Directions: E-W, SW-NE
Address range: 800 to 1700
Directions: E-W, SW-NE
Address range: 800 to 1700
W Barker Ave
Length: 0.51 miles
Direction: E-W
Address range: 1200 to 1699
Direction: E-W
Address range: 1200 to 1699
W St James St
Length: 0.47 miles
Direction: E-W
Address range: 800 to 1199
Direction: E-W
Address range: 800 to 1199
W Fredonia Ave
Length: 0.47 miles
Direction: E-W
Address range: 1300 to 1699
Direction: E-W
Address range: 1300 to 1699
W Windom St
Length: 0.46 miles
Direction: E-W
Address range: 800 to 1199
Direction: E-W
Address range: 800 to 1199
N Cooper St
Length: 0.30 miles
Directions: N-S, SE-NW
Address range: 300 to 699
Directions: N-S, SE-NW
Address range: 300 to 699
W Callender Ave
Length: 0.29 miles
Direction: E-W
Address range: 1500 to 1699
Direction: E-W
Address range: 1500 to 1699
W Bradley Ave
Length: 0.25 miles
Directions: E-W, N-S, SW-NE
Address range: 900 to 1199
Directions: E-W, N-S, SW-NE
Address range: 900 to 1199
N Glenwood Ave
Length: 0.23 miles
Directions: N-S, SE-NW
Address range: 300 to 699
Directions: N-S, SE-NW
Address range: 300 to 699
W College St
Length: 0.23 miles
Direction: E-W
Address range: 900 to 1199
Direction: E-W
Address range: 900 to 1199
N Garfield Ave
Length: 0.19 miles
Directions: N-S, SE-NW
Address range: 800 to 918
Directions: N-S, SE-NW
Address range: 800 to 918
N Underhill St
Length: 0.19 miles
Directions: N-S, SE-NW
Address range: 700 to 917
Directions: N-S, SE-NW
Address range: 700 to 917
N Institute Pl
Length: 0.17 miles
Directions: N-S, SE-NW
Address range: 400 to 699
Directions: N-S, SE-NW
Address range: 400 to 699
N Frink St
Length: 0.15 miles
Direction: N-S
Address range: 800 to 918
Direction: N-S
Address range: 800 to 918
W Ayers Ave
Length: 0.14 miles
Direction: E-W
Address range: 1600 to 1699
Direction: E-W
Address range: 1600 to 1699
N Douglas St
Length: 0.13 miles
Direction: N-S
Address range: 800 to 919
Direction: N-S
Address range: 800 to 919
N Orange St
Length: 0.12 miles
Directions: N-S, SE-NW
Address range: 800 to 917
Directions: N-S, SE-NW
Address range: 800 to 917
N Duryea Pl
Length: 0.08 miles
Direction: N-S
Address range: 600 to 699
Direction: N-S
Address range: 600 to 699
N Moss Ave Ter
Length: 0.08 miles
Direction: SE-NW
Address range: 600 to 699
Direction: SE-NW
Address range: 600 to 699