Milford Industrial neighborhood in Glendale, California (CA), 90039, 91203 detailed profile
Settings
X


Business Search - 14 Million verified businesses
Area: 0.081 square miles
Population: 911
Population density:
| Milford Industrial: | 11,300 people per square mile |
| Glendale: | 6,175 people per square mile |

- 57353.0%White
- 23121.3%Asian
- 16415.2%Black
- 555.1%Hispanic or Latino
- 514.7%American Indian
- 80.7%Two or more races

Median household income in 2022:
| Milford Industrial: | $72,018 |
| Glendale: | $77,483 |
Distribution of median household income
![Distribution of median household income]()
- 11Less than $10,000
- 13$10,000 to $19,999
- 121$20,000 to $29,999
- 173$30,000 to $39,999
- 33$40,000 to $49,999
- 18$50,000 to $59,999
- 27$60,000 to $74,999
- 162$75,000 to $99,999
- 42$100,000 to $124,999
- 94$125,000 to $149,999
- 20$150,000 to $199,999
- 61$200,000 or more

Distribution of owner-occupied house/condo value
![Distribution of owner-occupied house/condo value]()
- 12Less than $50,000
- 6$50,000 to $99,999
- 18$250,000 to $299,999
- 7$300,000 to $399,999
- 54$500,000 to $749,999
- 24$750,000 to $999,999
- 14$1,000,000 or more

Distribution of rent paid by renters
![Distribution of rent paid by renters]()
- 2$400 to $499
- 17$900 to $999
- 104$1,000 to $1,249
- 39$1,250 to $1,499
- 49$1,500 to $1,999
- 150$2,000 or more

Median rent in 2022:
| Milford Industrial: | $2,137 |
| Glendale: | $1,842 |
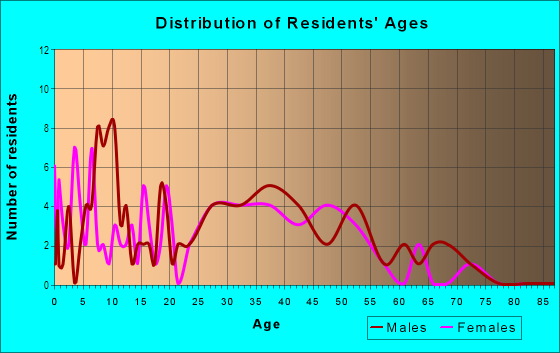
| Males: | 480 |
| Females: | 431 |
Males:
| This neighborhood: | 36.7 years |
| Whole city: | 41.8 years |
| This neighborhood: | 45.2 years |
| Whole city: | 43.4 years |
Average household size:
| Milford Industrial: | 2.8 people |
| Glendale: | 2.5 people |
Percentage of family households:
| Milford Industrial: | 40.8% |
| Glendale: | 40.0% |
| Here: | 45.4% |
| Glendale: | 44.2% |
Percentage of married-couple families with children (among all households):
| Milford Industrial: | 36.2% |
| Glendale: | 30.5% |
Percentage of single-mother households (among all households):
| Milford Industrial: | 1.0% |
| Glendale: | 7.0% |
Percentage of never married males 15 years old and over:
Percentage of never married females 15 years old and over:
| Milford Industrial: | 26.9% |
| Glendale: | 18.4% |
Percentage of never married females 15 years old and over:
| Milford Industrial: | 9.0% |
| city: | 18.3% |
Percentage of people that speak English not well or not at all:
| Milford Industrial: | 15.5% |
| Glendale: | 12.5% |
Percentage of people born in this state:
Percentage of people born in another U.S. state:
Percentage of native residents but born outside the U.S.:
Percentage of foreign born residents:
| Here: | 28.8% |
| Glendale: | 38.0% |
Percentage of people born in another U.S. state:
| Milford Industrial: | 8.6% |
| Glendale: | 11.6% |
Percentage of native residents but born outside the U.S.:
| Here: | 1.9% |
| city: | 1.5% |
Percentage of foreign born residents:
| Here: | 60.8% |
| Glendale: | 48.9% |
Owner-occupied
Renter-occupied


- Rooms in owner-occupied houses and condos in Milford Industrial
- 01 room
- 02 rooms
- 63 rooms
- 454 rooms
- 295 rooms
- 246 rooms
- 167 rooms
- 68 rooms
- 29+ rooms
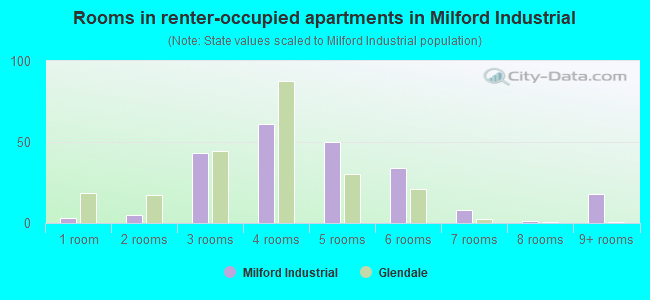
- Rooms in renter-occupied apartments in Milford Industrial
- 31 room
- 52 rooms
- 433 rooms
- 614 rooms
- 505 rooms
- 346 rooms
- 87 rooms
- 18 rooms
- 189+ rooms
Owner-occupied
Renter-occupied
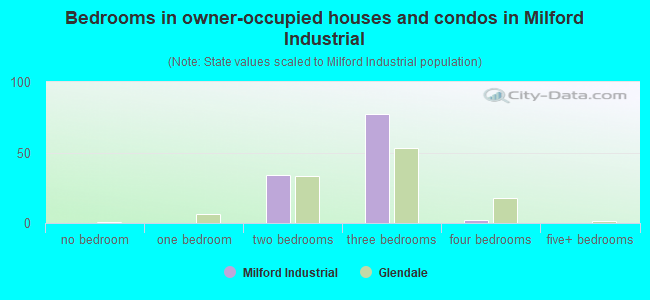
- Bedrooms in owner-occupied houses and condos in Milford Industrial
- 0no bedroom
- 01 bedroom
- 342 bedrooms
- 773 bedrooms
- 24 bedrooms
- 05+ bedrooms
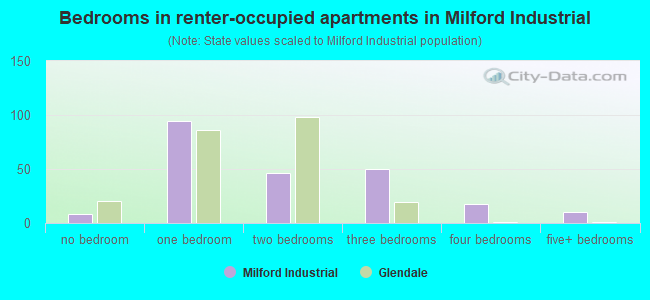
- Bedrooms in renter-occupied apartments in Milford Industrial
- 8no bedroom
- 941 bedroom
- 462 bedrooms
- 503 bedrooms
- 184 bedrooms
- 105+ bedrooms
Average number of cars or other vehicles available in houses/condos:
Average number of cars or other vehicles available in apartments:
| This neighborhood: | 2.0 |
| Glendale: | 2.0 |
Average number of cars or other vehicles available in apartments:
| Here: | 1.5 |
| city: | 1.4 |
Percentage of units with a mortgage:
| Milford Industrial: | 93.9% |
| Glendale: | 73.0% |
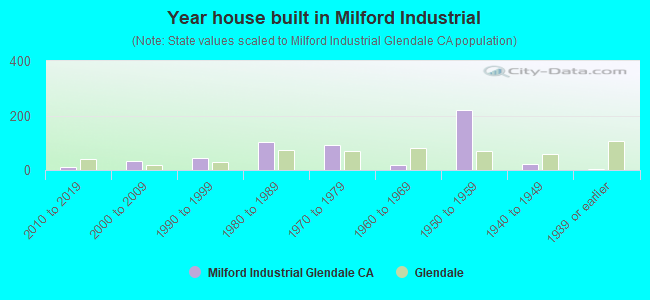
- Year house built in Milford Industrial
- 02020 or later
- 122010 to 2019
- 322000 to 2009
- 451990 to 1999
- 1011980 to 1989
- 921970 to 1979
- 171960 to 1969
- 2201950 to 1959
- 221940 to 1949
- 51939 or earlier

City-data.com crime index for city in 2020 (higher means more crime):
| City: | 110.5 |
| U.S. average: | 219.5 |
Travel time to work (commute)
![Travel time to work (commute)]()
- 205 to 9 minutes
- 4510 to 14 minutes
- 6115 to 19 minutes
- 4220 to 24 minutes
- 925 to 29 minutes
- 10030 to 34 minutes
- 135 to 39 minutes
- 4740 to 44 minutes
- 3645 to 59 minutes
- 1060 to 89 minutes
- 290 or more minutes

Means of transportation to work
![Means of transportation to work]()
- 77.6%358Drove a car alone
- 5.2%24Carpooled
- 0.7%3Bicycle
- 16.7%77Walked
- 1.7%8Other means
- 31.5%145Worked at home

Time leaving home to go to work
![Time leaving home to go to work]()
- 512:00 a.m. to 4:59 a.m.
- 155:00 a.m. to 5:29 a.m.
- 55:30 a.m. to 5:59 a.m.
- 316:00 a.m. to 6:29 a.m.
- 256:30 a.m. to 6:59 a.m.
- 567:00 a.m. to 7:29 a.m.
- 257:30 a.m. to 7:59 a.m.
- 828:00 a.m. to 8:29 a.m.
- 248:30 a.m. to 8:59 a.m.
- 289:00 a.m. to 9:59 a.m.
- 3310:00 a.m. to 10:59 a.m.
- 1212:00 p.m. to 3:59 p.m.
- 214:00 p.m. to 11:59 p.m.

Occupations of males:
- Percentage of males in management occupations (except farmers):
Here: 15.4% city: 12.9%
- Percentage of males in business and financial operations occupations:
Here: 6.8% city: 4.8%
- Percentage of males in computer and mathematical occupations:
Here: 1.7% city: 5.2%
- Percentage of males in architecture and engineering occupations:
Here: 5.6% city: 4.1%
- Percentage of males in education, training, and library occupations:
Here: 2.8% city: 2.0%
- Percentage of males in healthcare practitioners and technical occupations:
Here: 7.3% city: 5.5%
- Percentage of males in service occupations:
Here: 48.9% city: 11.8%
- Percentage of males in sales and office occupations:
Here: 9.6% city: 18.3%
- Percentage of males in construction, extraction, and maintenance occupations:
Here: 4.8% city: 5.5%
- Percentage of males in transportation occupations:
Here: 1.3% city: 6.0%
Occupations of females:
- Percentage of females in management occupations (except farmers):
Here: 4.8% city: 10.3%
- Percentage of females in computer and mathematical occupations:
Here: 1.9% city: 1.6%
- Percentage of females in community and social services occupations:
Here: 3.9% city: 2.8%
- Percentage of females in education, training, and library occupations:
Here: 13.1% city: 9.4%
- Percentage of females in arts, design, entertainment, sports, and media occupations:
Here: 2.9% city: 6.1%
- Percentage of females in healthcare practitioners and technical occupations:
Here: 10.5% city: 10.7%
- Percentage of females in service occupations:
Here: 49.8% city: 18.3%
- Percentage of females in sales and office occupations:
Here: 16.7% city: 26.5%
- Percentage of females in material moving occupations:
Here: 2.0% city: 0.7%
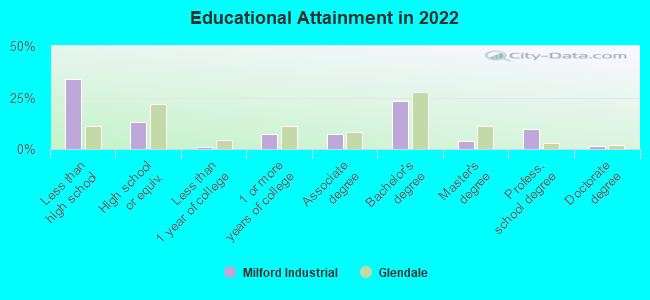
Education in this neighborhood (subdivision or community):
- Percentage of people 3 years and older in K-12 schools:
Milford Industrial: 35.6% Glendale: 14.1%
- Percentage of people 3 years and older in undergraduate colleges:
Milford Industrial: 22.9% Glendale: 5.2%
- Percentage of people 3 years and older in grad. or professional schools:
Milford Industrial: 11.8% Glendale: 1.9%
- Percentage of students K-12 enrolled in private schools:
Milford Industrial: 30.1% Glendale: 9.3%
Percentage of population below poverty level:
| Milford Industrial: | 15.4% |
| Glendale: | 13.0% |
Median year owner moved in (as recorded in 2022):
Median year renter moved in (as recorded in 2022):
| Milford Industrial: | 2001 |
| Glendale: | 2007 |
Median year renter moved in (as recorded in 2022):
| Milford Industrial: | 2015 |
| Glendale: | 2018 |
Percentage of married-couple families with both working:
| Milford Industrial: | 63.5% |
| Glendale: | 66.7% |
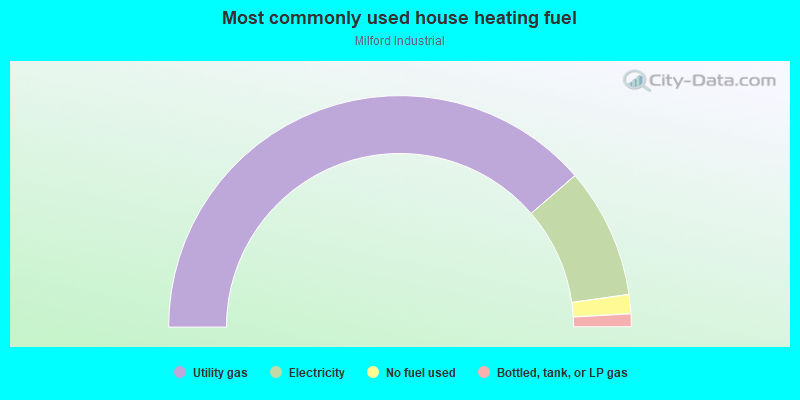
- 77.3%Utility gas
- 18.2%Electricity
- 2.7%No fuel used
- 1.8%Bottled, tank, or LP gas
Highways in this neighborhood:
San Fernando Rd (N San Fernando Rd)
Length: 0.41 miles
Direction: SE-NW
Address range: 5226 to 5549
Direction: SE-NW
Address range: 5226 to 5549
Roads and streets:
Concord St
Length: 0.30 miles
Direction: N-S
Address range: 200 to 499
Direction: N-S
Address range: 200 to 499
W Doran St
Length: 0.27 miles
Directions: E-W, SW-NE
Address range: 718 to 927
Directions: E-W, SW-NE
Address range: 718 to 927
W Milford St
Length: 0.24 miles
Direction: E-W
Address range: 727 to 899
Direction: E-W
Address range: 727 to 899
W California Ave
Length: 0.16 miles
Direction: E-W
Address range: 726 to 799
Direction: E-W
Address range: 726 to 799
State St
Length: 0.12 miles
Direction: N-S
Address range: 500 to 599
Direction: N-S
Address range: 500 to 599
Salem St
Length: 0.12 miles
Direction: E-W
Address range: 726 to 799
Direction: E-W
Address range: 726 to 799
Commercial St
Length: 0.09 miles
Direction: N-S
Address range: 500 to 599
Direction: N-S
Address range: 500 to 599
W Wilson Ave
Length: 0.09 miles
Direction: E-W
Address range: 726 to 799
Direction: E-W
Address range: 726 to 799