Medical District neighborhood in Huntsville, Alabama (AL), 35801 detailed profile
Settings
X


Business Search - 14 Million verified businesses
Area: 0.251 square miles
Population: 640
Population density:
| Medical District: | 2,549 people per square mile |
| Huntsville: | 1,278 people per square mile |

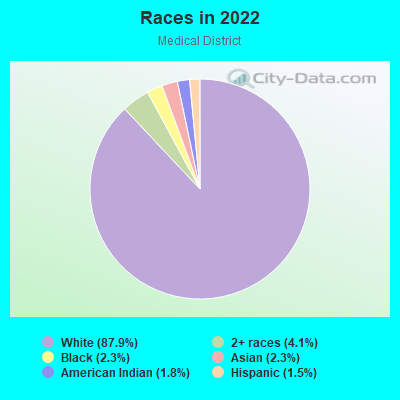
- 57487.9%White
- 274.1%Two or more races
- 152.3%Black
- 152.3%Asian
- 121.8%American Indian
- 101.5%Hispanic or Latino
Median household income in 2022:
| Medical District: | $147,994 |
| Huntsville: | $68,930 |
Distribution of median household income
![Distribution of median household income]()
- 12Less than $10,000
- 11$10,000 to $19,999
- 41$20,000 to $29,999
- 16$30,000 to $39,999
- 13$40,000 to $49,999
- 32$50,000 to $59,999
- 24$60,000 to $74,999
- 50$75,000 to $99,999
- 27$100,000 to $124,999
- 33$125,000 to $149,999
- 38$150,000 to $199,999
- 63$200,000 or more

Distribution of owner-occupied house/condo value
![Distribution of owner-occupied house/condo value]()
- 61Less than $50,000
- 11$50,000 to $99,999
- 6$100,000 to $149,999
- 40$150,000 to $199,999
- 22$200,000 to $249,999
- 37$250,000 to $299,999
- 34$300,000 to $399,999
- 55$400,000 to $499,999
- 59$500,000 to $749,999
- 10$750,000 to $999,999
- 16$1,000,000 or more

Distribution of rent paid by renters
![Distribution of rent paid by renters]()
- 10$200 to $299
- 25$700 to $799
- 5$900 to $999
- 5$1,000 to $1,249
- 8$1,250 to $1,499
- 3$1,500 to $1,999
- 1$2,000 or more

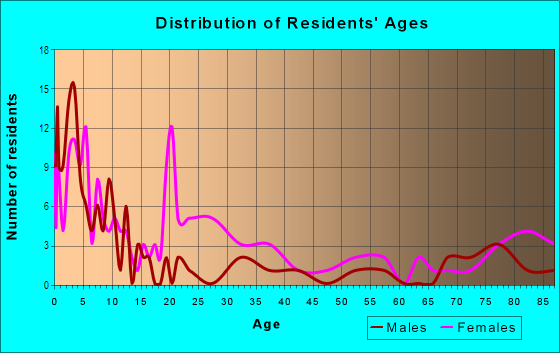
| Males: | 284 |
| Females: | 356 |
Males:
| This neighborhood: | 52.1 years |
| Whole city: | 36.0 years |
| This neighborhood: | 49.2 years |
| Whole city: | 37.7 years |
Average household size:
| Medical District: | 2.1 people |
| Huntsville: | 2.2 people |
Percentage of family households:
| Medical District: | 29.7% |
| Huntsville: | 39.9% |
| Here: | 43.2% |
| Huntsville: | 39.5% |
Percentage of married-couple families with children (among all households):
| Medical District: | 35.2% |
| Huntsville: | 29.0% |
Percentage of single-mother households (among all households):
| Medical District: | 15.3% |
| Huntsville: | 10.3% |
Percentage of never married males 15 years old and over:
Percentage of never married females 15 years old and over:
| Medical District: | 12.1% |
| Huntsville: | 20.0% |
Percentage of never married females 15 years old and over:
| Medical District: | 16.5% |
| city: | 17.9% |
Percentage of people that speak English not well or not at all:
| Medical District: | 0.0% |
| Huntsville: | 1.3% |
Percentage of people born in this state:
Percentage of people born in another U.S. state:
Percentage of native residents but born outside the U.S.:
Percentage of foreign born residents:
| Here: | 55.6% |
| Huntsville: | 52.1% |
Percentage of people born in another U.S. state:
| Medical District: | 39.9% |
| Huntsville: | 40.5% |
Percentage of native residents but born outside the U.S.:
| Here: | 1.4% |
| city: | 1.8% |
Percentage of foreign born residents:
| Here: | 3.1% |
| Huntsville: | 5.6% |
Owner-occupied
Renter-occupied

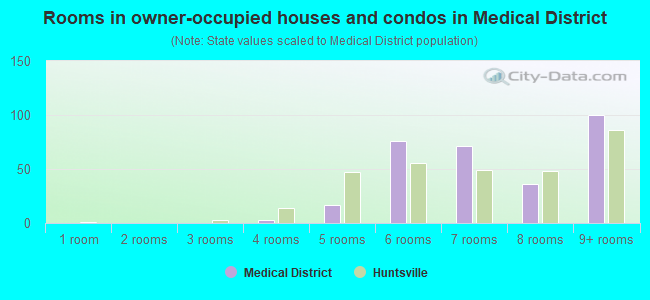
- Rooms in owner-occupied houses and condos in Medical District
- 01 room
- 02 rooms
- 03 rooms
- 34 rooms
- 175 rooms
- 766 rooms
- 717 rooms
- 368 rooms
- 1009+ rooms
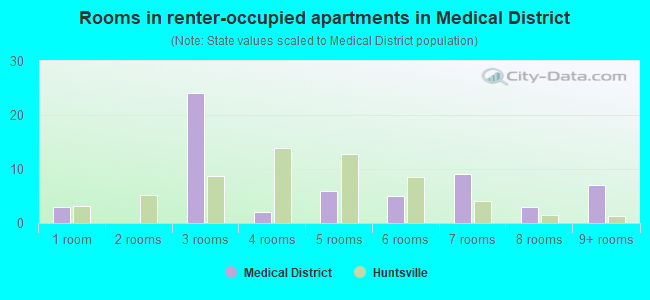
- Rooms in renter-occupied apartments in Medical District
- 31 room
- 02 rooms
- 243 rooms
- 24 rooms
- 65 rooms
- 56 rooms
- 97 rooms
- 38 rooms
- 79+ rooms
Owner-occupied
Renter-occupied
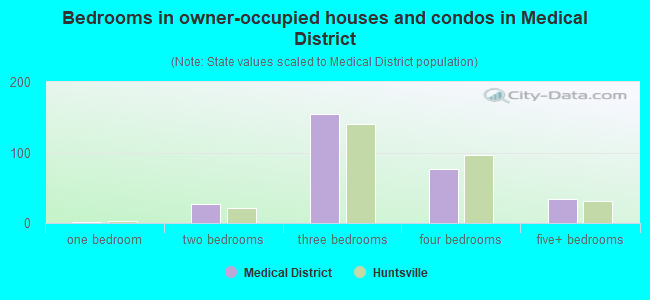
- Bedrooms in owner-occupied houses and condos in Medical District
- 0no bedroom
- 11 bedroom
- 272 bedrooms
- 1543 bedrooms
- 764 bedrooms
- 345+ bedrooms
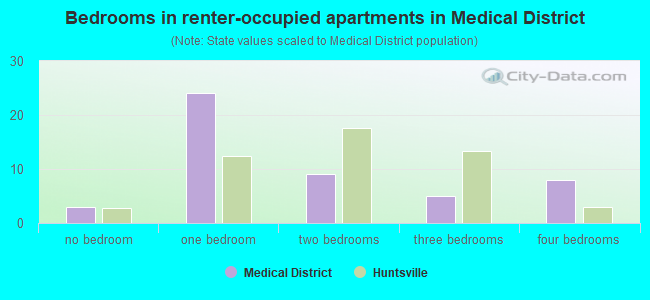
- Bedrooms in renter-occupied apartments in Medical District
- 3no bedroom
- 241 bedroom
- 92 bedrooms
- 53 bedrooms
- 84 bedrooms
- 05+ bedrooms
Average number of cars or other vehicles available in houses/condos:
Average number of cars or other vehicles available in apartments:
| This neighborhood: | 1.6 |
| Huntsville: | 2.0 |
Average number of cars or other vehicles available in apartments:
| Here: | 2.3 |
| city: | 1.4 |
Percentage of units with a mortgage:
| Medical District: | 59.8% |
| Huntsville: | 63.3% |
Average estimated value of detached houses in 2022 (91.6% of all units):
| Medical District: | $460,641 |
| Huntsville: | $373,670 |
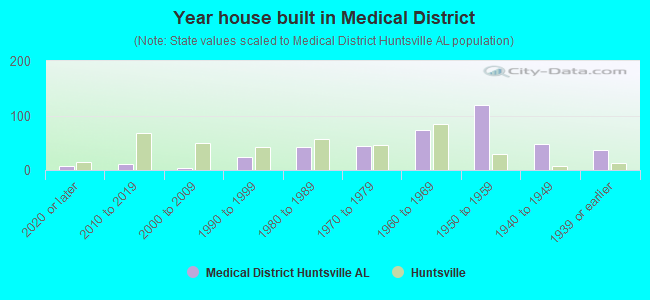
- Year house built in Medical District
- 72020 or later
- 112010 to 2019
- 42000 to 2009
- 241990 to 1999
- 421980 to 1989
- 441970 to 1979
- 731960 to 1969
- 1201950 to 1959
- 471940 to 1949
- 361939 or earlier

City-data.com crime index for city in 2020 (higher means more crime):
| City: | 176.6 |
| U.S. average: | 219.5 |
Travel time to work (commute)
![Travel time to work (commute)]()
- 4Less than 5 minutes
- 455 to 9 minutes
- 3210 to 14 minutes
- 4215 to 19 minutes
- 3520 to 24 minutes
- 1025 to 29 minutes
- 730 to 34 minutes
- 735 to 39 minutes
- 245 to 59 minutes
- 290 or more minutes

Means of transportation to work
![Means of transportation to work]()
- 70.1%258Drove a car alone
- 7.1%26Carpooled
- 0.3%1Bicycle
- 0.5%2Walked
- 22.0%81Worked at home

Time leaving home to go to work
![Time leaving home to go to work]()
- 212:00 a.m. to 4:59 a.m.
- 15:00 a.m. to 5:29 a.m.
- 65:30 a.m. to 5:59 a.m.
- 96:00 a.m. to 6:29 a.m.
- 166:30 a.m. to 6:59 a.m.
- 237:00 a.m. to 7:29 a.m.
- 427:30 a.m. to 7:59 a.m.
- 428:00 a.m. to 8:29 a.m.
- 148:30 a.m. to 8:59 a.m.
- 79:00 a.m. to 9:59 a.m.
- 310:00 a.m. to 10:59 a.m.
- 111:00 a.m. to 11:59 a.m.
- 212:00 p.m. to 3:59 p.m.
- 124:00 p.m. to 11:59 p.m.

Occupations of males:
- Percentage of males in management occupations (except farmers):
Here: 22.3% city: 11.0%
- Percentage of males in business and financial operations occupations:
Here: 4.4% city: 6.5%
- Percentage of males in computer and mathematical occupations:
Here: 16.5% city: 9.7%
- Percentage of males in architecture and engineering occupations:
Here: 10.3% city: 12.6%
- Percentage of males in life, physical, and social science occupations:
Here: 1.0% city: 1.7%
- Percentage of males in community and social services occupations:
Here: 2.4% city: 1.4%
- Percentage of males in arts, design, entertainment, sports, and media occupations:
Here: 5.4% city: 1.7%
- Percentage of males in healthcare practitioners and technical occupations:
Here: 9.0% city: 3.7%
- Percentage of males in service occupations:
Here: 6.4% city: 12.3%
- Percentage of males in sales and office occupations:
Here: 8.7% city: 11.3%
- Percentage of males in construction, extraction, and maintenance occupations:
Here: 7.0% city: 6.1%
- Percentage of males in production occupations:
Here: 1.2% city: 6.8%
- Percentage of males in transportation occupations:
Here: 6.8% city: 3.5%
Occupations of females:
- Percentage of females in management occupations (except farmers):
Here: 20.0% city: 8.4%
- Percentage of females in business and financial operations occupations:
Here: 10.9% city: 7.2%
- Percentage of females in computer and mathematical occupations:
Here: 1.3% city: 3.6%
- Percentage of females in architecture and engineering occupations:
Here: 1.5% city: 2.4%
- Percentage of females in life, physical, and social science occupations:
Here: 2.1% city: 0.7%
- Percentage of females in community and social services occupations:
Here: 1.7% city: 2.5%
- Percentage of females in legal occupations:
Here: 2.1% city: 0.8%
- Percentage of females in education, training, and library occupations:
Here: 8.5% city: 8.9%
- Percentage of females in arts, design, entertainment, sports, and media occupations:
Here: 23.7% city: 2.1%
- Percentage of females in healthcare practitioners and technical occupations:
Here: 12.5% city: 10.3%
- Percentage of females in service occupations:
Here: 3.1% city: 18.8%
- Percentage of females in sales and office occupations:
Here: 20.6% city: 25.5%
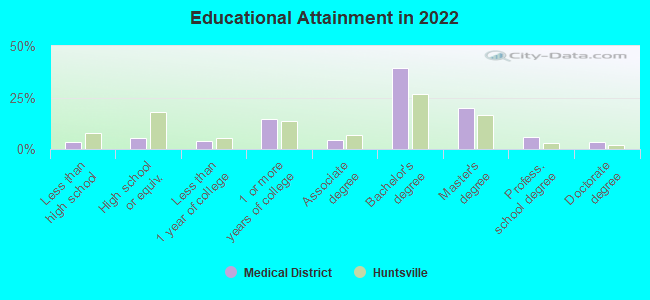
Education in this neighborhood (subdivision or community):
- Percentage of people 3 years and older in K-12 schools:
Medical District: 13.7% Huntsville: 14.2%
- Percentage of people 3 years and older in undergraduate colleges:
Medical District: 2.6% Huntsville: 8.3%
- Percentage of people 3 years and older in grad. or professional schools:
Medical District: 3.1% Huntsville: 2.3%
- Percentage of students K-12 enrolled in private schools:
Medical District: 44.6% Huntsville: 21.2%
Percentage of population below poverty level:
| Medical District: | 2.9% |
| Huntsville: | 13.9% |
Median year owner moved in (as recorded in 2022):
| Medical District: | 2006 |
| Huntsville: | 2012 |
Percentage of married-couple families with both working:
| Medical District: | 86.0% |
| Huntsville: | 66.5% |
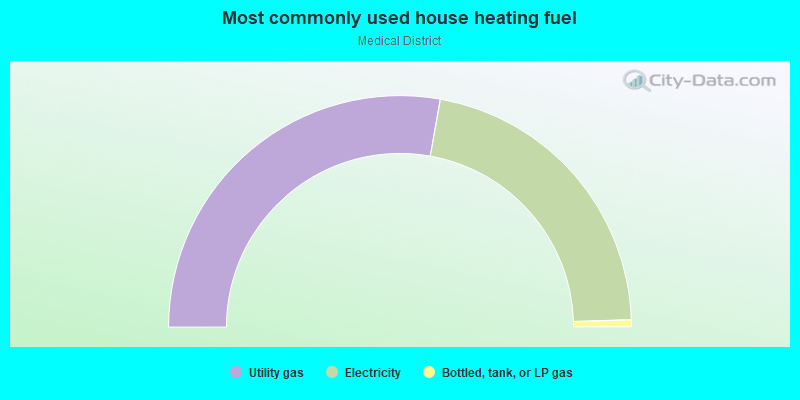
- 55.6%Utility gas
- 43.4%Electricity
- 1.0%Bottled, tank, or LP gas
Highways in this neighborhood:
US Hwy 431 (State Rte 1, Governors Dr SE)
Length: 0.39 miles
Direction: E-W
Address range: 100 to 703
Direction: E-W
Address range: 100 to 703
Roads and streets:
California St SE
Length: 0.43 miles
Direction: N-S
Address range: 700 to 1999
Direction: N-S
Address range: 700 to 1999
Franklin St SE
Length: 0.40 miles
Directions: N-S, SE-NW
Address range: 700 to 999
Directions: N-S, SE-NW
Address range: 700 to 999
Lowe Ave SE
Length: 0.38 miles
Directions: E-W, SW-NE
Address range: 100 to 499
Directions: E-W, SW-NE
Address range: 100 to 499
Adams St SE
Length: 0.36 miles
Direction: SE-NW
Address range: 717 to 999
Direction: SE-NW
Address range: 717 to 999
Madison St
Length: 0.34 miles
Directions: N-S, SE-NW
Address range: 708 to 999
Directions: N-S, SE-NW
Address range: 708 to 999
Rands Ave SE
Length: 0.33 miles
Directions: E-W, SE-NW, SW-NE
Address range: 100 to 399
Directions: E-W, SE-NW, SW-NE
Address range: 100 to 399
Lowe Ave SW
Length: 0.28 miles
Direction: E-W
Direction: E-W
Pelham Ave SW
Length: 0.27 miles
Directions: E-W, SW-NE
Address range: 300 to 453
Directions: E-W, SW-NE
Address range: 300 to 453
Lowell Dr SE
Length: 0.27 miles
Directions: E-W, SW-NE
Address range: 300 to 599
Directions: E-W, SW-NE
Address range: 300 to 599
Gallatin St SW
Length: 0.23 miles
Direction: SE-NW
Address range: 600 to 899
Direction: SE-NW
Address range: 600 to 899
Townsend Ave SE
Length: 0.20 miles
Directions: E-W, SW-NE
Address range: 200 to 399
Directions: E-W, SW-NE
Address range: 200 to 399
Sivley Rd SW
Length: 0.18 miles
Direction: E-W
Address range: 100 to 283
Direction: E-W
Address range: 100 to 283
St Clair Ave SW
Length: 0.18 miles
Direction: E-W
Address range: 100 to 299
Direction: E-W
Address range: 100 to 299
Coltart Ln SE
Length: 0.18 miles
Direction: E-W
Address range: 100 to 199
Direction: E-W
Address range: 100 to 199
St Clair Ave SE
Length: 0.13 miles
Direction: E-W
Address range: 100 to 199
Direction: E-W
Address range: 100 to 199
Big Cove Rd SE
Length: 0.12 miles
Directions: E-W, SW-NE
Address range: 900 to 999
Directions: E-W, SW-NE
Address range: 900 to 999
Davis Cir SW
Length: 0.10 miles
Directions: E-W, SE-NW
Address range: 479 to 699
Directions: E-W, SE-NW
Address range: 479 to 699
Adams Aly SE
Length: 0.08 miles
Direction: SW-NE
Address range: 1 to 99
Direction: SW-NE
Address range: 1 to 99
Other features:
Fagan Crk
Length: 0.70 miles
Directions: E-W, SE-NW
Directions: E-W, SE-NW