Medical Center neighborhood in Las Vegas, Nevada (NV), 89106 detailed profile
Settings
X


Business Search - 14 Million verified businesses
Area: 0.371 square miles
Population: 2,067
Population density:
| Medical Center: | 5,575 people per square mile |
| Las Vegas: | 5,792 people per square mile |

- 77736.9%Black
- 56126.6%Hispanic or Latino
- 54826.0%White
- 894.2%Two or more races
- 633.0%Asian
- 622.9%American Indian
- 60.3%Native Hawaiian and Other
Pacific Islander - 20.09%Some other race

Distribution of median household income
![Distribution of median household income]()
- 401Less than $10,000
- 122$10,000 to $19,999
- 243$20,000 to $29,999
- 145$30,000 to $39,999
- 161$40,000 to $49,999
- 239$50,000 to $59,999
- 126$60,000 to $74,999
- 137$75,000 to $99,999
- 53$100,000 to $124,999
- 136$125,000 to $149,999
- 40$150,000 to $199,999
- 96$200,000 or more

Distribution of owner-occupied house/condo value
![Distribution of owner-occupied house/condo value]()
- 14Less than $50,000
- 34$50,000 to $99,999
- 10$100,000 to $149,999
- 68$150,000 to $199,999
- 44$200,000 to $249,999
- 43$250,000 to $299,999
- 166$300,000 to $399,999
- 48$400,000 to $499,999
- 75$500,000 to $749,999
- 21$750,000 to $999,999
- 34$1,000,000 or more

Distribution of rent paid by renters
![Distribution of rent paid by renters]()
- 5$400 to $499
- 44$500 to $599
- 64$600 to $699
- 50$700 to $799
- 23$800 to $899
- 99$900 to $999
- 194$1,000 to $1,249
- 363$1,250 to $1,499
- 149$1,500 to $1,999
- 20$2,000 or more

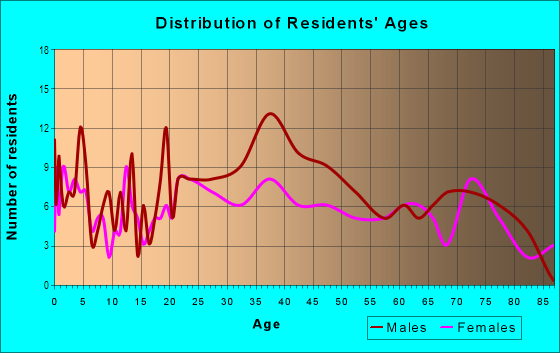
| Males: | 1,199 |
| Females: | 868 |
Males:
| This neighborhood: | 40.1 years |
| Whole city: | 38.4 years |
| This neighborhood: | 40.2 years |
| Whole city: | 38.9 years |
Average household size:
| Medical Center: | 2.6 people |
| Las Vegas: | 2.7 people |
Percentage of family households:
| Medical Center: | 33.3% |
| Las Vegas: | 45.8% |
| Here: | 14.0% |
| Las Vegas: | 40.9% |
Percentage of married-couple families with children (among all households):
| Medical Center: | 8.3% |
| Las Vegas: | 23.4% |
Percentage of single-mother households (among all households):
| Medical Center: | 13.0% |
| Las Vegas: | 10.1% |
Percentage of never married males 15 years old and over:
Percentage of never married females 15 years old and over:
| Medical Center: | 35.2% |
| Las Vegas: | 19.7% |
Percentage of never married females 15 years old and over:
| Medical Center: | 17.8% |
| city: | 17.0% |
Percentage of people that speak English not well or not at all:
| Medical Center: | 2.4% |
| Las Vegas: | 7.0% |
Percentage of people born in this state:
Percentage of people born in another U.S. state:
Percentage of native residents but born outside the U.S.:
Percentage of foreign born residents:
| Here: | 26.7% |
| Las Vegas: | 27.3% |
Percentage of people born in another U.S. state:
| Medical Center: | 52.2% |
| Las Vegas: | 49.8% |
Percentage of native residents but born outside the U.S.:
| Here: | 1.5% |
| city: | 1.9% |
Percentage of foreign born residents:
| Here: | 19.6% |
| Las Vegas: | 21.0% |

Owner-occupied
Renter-occupied


- Rooms in owner-occupied houses and condos in Medical Center
- 81 room
- 02 rooms
- 263 rooms
- 1504 rooms
- 915 rooms
- 946 rooms
- 417 rooms
- 308 rooms
- 639+ rooms

- Rooms in renter-occupied apartments in Medical Center
- 3251 room
- 892 rooms
- 3523 rooms
- 3024 rooms
- 1535 rooms
- 336 rooms
- 627 rooms
- 168 rooms
- 49+ rooms
Owner-occupied
Renter-occupied

- Bedrooms in owner-occupied houses and condos in Medical Center
- 6no bedroom
- 01 bedroom
- 1992 bedrooms
- 1403 bedrooms
- 444 bedrooms
- 185+ bedrooms

- Bedrooms in renter-occupied apartments in Medical Center
- 357no bedroom
- 4601 bedroom
- 3482 bedrooms
- 433 bedrooms
- 44 bedrooms
- 45+ bedrooms
Average number of cars or other vehicles available in houses/condos:
Average number of cars or other vehicles available in apartments:
| This neighborhood: | |
| Las Vegas: |
Average number of cars or other vehicles available in apartments:
| Here: | 0.6 |
| city: | 1.3 |
Percentage of units with a mortgage:
| Medical Center: | 89.2% |
| Las Vegas: | 69.3% |

- Year house built in Medical Center
- 02020 or later
- 552010 to 2019
- 2562000 to 2009
- 4871990 to 1999
- 3541980 to 1989
- 1581970 to 1979
- 891960 to 1969
- 181950 to 1959
- 691940 to 1949
- 01939 or earlier

City-data.com crime index for city in 2020 (higher means more crime):
| City: | 280.7 |
| U.S. average: | 219.5 |
Travel time to work (commute)
![Travel time to work (commute)]()
- 20Less than 5 minutes
- 285 to 9 minutes
- 11910 to 14 minutes
- 18915 to 19 minutes
- 27020 to 24 minutes
- 4125 to 29 minutes
- 13930 to 34 minutes
- 5135 to 39 minutes
- 7845 to 59 minutes
- 3260 to 89 minutes
- 690 or more minutes

Means of transportation to work
![Means of transportation to work]()
- 48.8%356Drove a car alone
- 34.7%253Carpooled
- 18.2%133Bus
- 0.3%2Ferryboat
- 9.5%69Taxi
- 5.1%37Motorcycle
- 1.0%7Bicycle
- 33.7%246Walked
- 7.1%52Other means
- 10.0%73Worked at home

Time leaving home to go to work
![Time leaving home to go to work]()
- 3012:00 a.m. to 4:59 a.m.
- 245:00 a.m. to 5:29 a.m.
- 345:30 a.m. to 5:59 a.m.
- 986:00 a.m. to 6:29 a.m.
- 716:30 a.m. to 6:59 a.m.
- 1187:00 a.m. to 7:29 a.m.
- 467:30 a.m. to 7:59 a.m.
- 1048:00 a.m. to 8:29 a.m.
- 288:30 a.m. to 8:59 a.m.
- 809:00 a.m. to 9:59 a.m.
- 4210:00 a.m. to 10:59 a.m.
- 1211:00 a.m. to 11:59 a.m.
- 6612:00 p.m. to 3:59 p.m.
- 1754:00 p.m. to 11:59 p.m.

Occupations of males:
- Percentage of males in architecture and engineering occupations:
Here: 6.8% city: 1.8%
- Percentage of males in arts, design, entertainment, sports, and media occupations:
Here: 5.6% city: 2.5%
- Percentage of males in healthcare practitioners and technical occupations:
Here: 5.5% city: 3.3%
- Percentage of males in service occupations:
Here: 30.4% city: 23.3%
- Percentage of males in sales and office occupations:
Here: 15.7% city: 16.6%
- Percentage of males in construction, extraction, and maintenance occupations:
Here: 13.0% city: 10.6%
- Percentage of males in material moving occupations:
Here: 12.3% city: 5.4%
Occupations of females:
- Percentage of females in management occupations (except farmers):
Here: 4.1% city: 8.5%
- Percentage of females in healthcare practitioners and technical occupations:
Here: 9.0% city: 7.4%
- Percentage of females in service occupations:
Here: 1.3% city: 26.5%
- Percentage of females in sales and office occupations:
Here: 59.8% city: 30.5%
- Percentage of females in production occupations:
Here: 12.2% city: 1.8%
- Percentage of females in transportation occupations:
Here: 13.5% city: 1.6%
Education in this neighborhood (subdivision or community):
- Percentage of people 3 years and older in K-12 schools:
Medical Center: 38.1% Las Vegas: 17.4%
- Percentage of people 3 years and older in undergraduate colleges:
Medical Center: 5.3% Las Vegas: 4.2%
- Percentage of people 3 years and older in grad. or professional schools:
Medical Center: 1.7% Las Vegas: 1.0%
- Percentage of students K-12 enrolled in private schools:
Medical Center: 9.5% Las Vegas: 12.9%
Percentage of population below poverty level:
| Medical Center: | 28.3% |
| Las Vegas: | 14.1% |
Percentage of married-couple families with both working:
| Medical Center: | 63.9% |
| Las Vegas: | 62.0% |

- 70.3%Electricity
- 18.0%Utility gas
- 7.5%Bottled, tank, or LP gas
- 2.6%No fuel used
- 1.5%Solar energy
Limited-access highways (interstate or state) in this neighborhood:
Las Vegas Fwy (I- 15)
Length: 1.02 miles
Direction: N-S
Address range: 800 to 810
Direction: N-S
Address range: 800 to 810
Highways in this neighborhood:
W Charleston Blvd (State Rte 159)
Length: 0.05 miles
Direction: E-W
Address range: 1000 to 1499
Direction: E-W
Address range: 1000 to 1499
Roads and streets:
Alta Dr
Length: 0.84 miles
Direction: E-W
Address range: 1400 to 2198
Direction: E-W
Address range: 1400 to 2198
Pinto Ln
Length: 0.72 miles
Direction: E-W
Address range: 1400 to 2199
Direction: E-W
Address range: 1400 to 2199
Desert Ln
Length: 0.51 miles
Direction: N-S
Address range: 500 to 1099
Direction: N-S
Address range: 500 to 1099
S Martin L King Blvd
Length: 0.51 miles
Direction: N-S
Address range: 500 to 1099
Direction: N-S
Address range: 500 to 1099
Shadow Ln
Length: 0.44 miles
Direction: N-S
Address range: 500 to 999
Direction: N-S
Address range: 500 to 999
S Tonopah Dr
Length: 0.43 miles
Direction: N-S
Address range: 500 to 899
Direction: N-S
Address range: 500 to 899
Rose St
Length: 0.35 miles
Directions: N-S, SW-NE
Address range: 500 to 898
Directions: N-S, SW-NE
Address range: 500 to 898
Goldring Ave
Length: 0.31 miles
Direction: E-W
Address range: 1800 to 2099
Direction: E-W
Address range: 1800 to 2099
Kenyon Pl
Length: 0.23 miles
Direction: E-W
Address range: 1500 to 1799
Direction: E-W
Address range: 1500 to 1799
Bearden (Bearden Dr)
Length: 0.17 miles
Directions: E-W, N-S, SE-NW, SW-NE
Address range: 701 to 1799
Directions: E-W, N-S, SE-NW, SW-NE
Address range: 701 to 1799
Hastings Ave
Length: 0.16 miles
Direction: E-W
Address range: 1500 to 1699
Direction: E-W
Address range: 1500 to 1699
Hamilton Ln
Length: 0.15 miles
Direction: E-W
Address range: 2000 to 2099
Direction: E-W
Address range: 2000 to 2099
Valerie St
Length: 0.15 miles
Directions: E-W, SW-NE
Address range: 2000 to 2099
Directions: E-W, SW-NE
Address range: 2000 to 2099
Truluck Ln
Length: 0.13 miles
Direction: N-S
Address range: 600 to 699
Direction: N-S
Address range: 600 to 699
Willow St
Length: 0.12 miles
Direction: N-S
Address range: 800 to 999
Direction: N-S
Address range: 800 to 999
Palomino Ln
Length: 0.09 miles
Direction: E-W
Address range: 2000 to 2098
Direction: E-W
Address range: 2000 to 2098
Alturas Ave
Length: 0.08 miles
Direction: E-W
Address range: 1800 to 1899
Direction: E-W
Address range: 1800 to 1899
Kingsbury Ln
Length: 0.07 miles
Direction: N-S
Address range: 600 to 699
Direction: N-S
Address range: 600 to 699
Rancho Ln
Length: 0.03 miles
Direction: SE-NW
Address range: 976 to 999
Direction: SE-NW
Address range: 976 to 999