McNeil neighborhood in Burbank, California (CA), 91505 detailed profile
Settings
X


Business Search - 14 Million verified businesses
Area: 0.905 square miles
Population: 9,056
Population density:
| McNeil: | 10,002 people per square mile |
| Burbank: | 5,990 people per square mile |

- 4,72546.2%White
- 1,76017.2%Two or more races
- 1,71816.8%Hispanic or Latino
- 8178.0%Asian
- 7437.3%Black
- 2772.7%Some other race
- 1101.1%American Indian
- 740.7%Native Hawaiian and Other
Pacific Islander

Median household income in 2022:
| McNeil: | $139,817 |
| Burbank: | $92,581 |
Distribution of median household income
![Distribution of median household income]()
- 225Less than $10,000
- 164$10,000 to $19,999
- 198$20,000 to $29,999
- 116$30,000 to $39,999
- 152$40,000 to $49,999
- 110$50,000 to $59,999
- 201$60,000 to $74,999
- 515$75,000 to $99,999
- 400$100,000 to $124,999
- 436$125,000 to $149,999
- 444$150,000 to $199,999
- 856$200,000 or more

Distribution of owner-occupied house/condo value
![Distribution of owner-occupied house/condo value]()
- 9Less than $50,000
- 132$50,000 to $99,999
- 62$300,000 to $399,999
- 19$400,000 to $499,999
- 123$500,000 to $749,999
- 493$750,000 to $999,999
- 1,033$1,000,000 or more

Distribution of rent paid by renters
![Distribution of rent paid by renters]()
- 37$200 to $299
- 32$300 to $399
- 26$500 to $599
- 17$600 to $699
- 16$700 to $799
- 96$800 to $899
- 155$900 to $999
- 125$1,000 to $1,249
- 76$1,250 to $1,499
- 579$1,500 to $1,999
- 1,023$2,000 or more

Median rent in 2022:
| McNeil: | $2,141 |
| Burbank: | $1,871 |
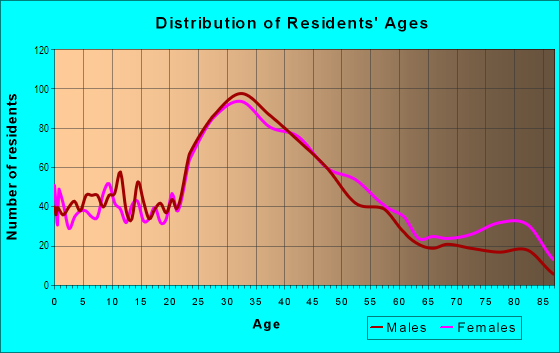
| Males: | 4,461 |
| Females: | 4,595 |
Males:
| This neighborhood: | 41.6 years |
| Whole city: | 36.7 years |
| This neighborhood: | 40.3 years |
| Whole city: | 42.1 years |
Average household size:
| McNeil: | 2.7 people |
| Burbank: | 2.4 people |
Percentage of family households:
| McNeil: | 46.9% |
| Burbank: | 43.5% |
| Here: | 46.5% |
| Burbank: | 40.3% |
Percentage of married-couple families with children (among all households):
| McNeil: | 35.1% |
| Burbank: | 32.8% |
Percentage of single-mother households (among all households):
| McNeil: | 3.4% |
| Burbank: | 7.0% |
Percentage of never married males 15 years old and over:
Percentage of never married females 15 years old and over:
| McNeil: | 23.0% |
| Burbank: | 20.3% |
Percentage of never married females 15 years old and over:
| McNeil: | 20.0% |
| city: | 18.6% |
Percentage of people that speak English not well or not at all:
| McNeil: | 0.8% |
| Burbank: | 5.9% |
Percentage of people born in this state:
Percentage of people born in another U.S. state:
Percentage of native residents but born outside the U.S.:
Percentage of foreign born residents:
| Here: | 56.8% |
| Burbank: | 50.1% |
Percentage of people born in another U.S. state:
| McNeil: | 26.5% |
| Burbank: | 21.2% |
Percentage of native residents but born outside the U.S.:
| Here: | 2.6% |
| city: | 1.2% |
Percentage of foreign born residents:
| Here: | 14.1% |
| Burbank: | 27.4% |

Owner-occupied
Renter-occupied


- Rooms in owner-occupied houses and condos in McNeil
- 01 room
- 282 rooms
- 753 rooms
- 1574 rooms
- 2455 rooms
- 4436 rooms
- 4907 rooms
- 2878 rooms
- 829+ rooms

- Rooms in renter-occupied apartments in McNeil
- 1771 room
- 2702 rooms
- 5693 rooms
- 5534 rooms
- 4305 rooms
- 1356 rooms
- 847 rooms
- 188 rooms
- 139+ rooms
Owner-occupied
Renter-occupied

- Bedrooms in owner-occupied houses and condos in McNeil
- 63no bedroom
- 601 bedroom
- 2662 bedrooms
- 1,1143 bedrooms
- 1604 bedrooms
- 635+ bedrooms

- Bedrooms in renter-occupied apartments in McNeil
- 140no bedroom
- 7231 bedroom
- 7322 bedrooms
- 1853 bedrooms
- 864 bedrooms
- 05+ bedrooms
Average number of cars or other vehicles available in houses/condos:
Average number of cars or other vehicles available in apartments:
| This neighborhood: | 2.1 |
| Burbank: | 2.1 |
Average number of cars or other vehicles available in apartments:
| Here: | 1.4 |
| city: | 1.3 |
Percentage of units with a mortgage:
| McNeil: | 79.7% |
| Burbank: | 73.7% |
Average estimated value of detached houses in 2022 (56.4% of all units):
| McNeil: | $1,493,043 |
| Burbank: | $1,253,446 |

- Year house built in McNeil
- 632020 or later
- 1102010 to 2019
- 722000 to 2009
- 3911990 to 1999
- 5691980 to 1989
- 871970 to 1979
- 2351960 to 1969
- 5671950 to 1959
- 1,0371940 to 1949
- 1,0581939 or earlier

City-data.com crime index for city in 2020 (higher means more crime):
| City: | 164.4 |
| U.S. average: | 219.5 |
Travel time to work (commute)
![Travel time to work (commute)]()
- 133Less than 5 minutes
- 6185 to 9 minutes
- 43710 to 14 minutes
- 42415 to 19 minutes
- 27320 to 24 minutes
- 14425 to 29 minutes
- 43030 to 34 minutes
- 9135 to 39 minutes
- 13240 to 44 minutes
- 26945 to 59 minutes
- 28860 to 89 minutes
- 3790 or more minutes

Means of transportation to work
![Means of transportation to work]()
- 55.1%2,823Drove a car alone
- 7.6%387Carpooled
- 2.0%102Bus
- 1.3%68Subway or elevated rail
- 1.5%76Taxi
- 0.9%47Motorcycle
- 3.5%177Bicycle
- 3.0%153Walked
- 1.7%88Other means
- 33.0%1,688Worked at home

Time leaving home to go to work
![Time leaving home to go to work]()
- 9412:00 a.m. to 4:59 a.m.
- 1495:00 a.m. to 5:29 a.m.
- 1095:30 a.m. to 5:59 a.m.
- 1956:00 a.m. to 6:29 a.m.
- 3076:30 a.m. to 6:59 a.m.
- 4047:00 a.m. to 7:29 a.m.
- 2997:30 a.m. to 7:59 a.m.
- 5868:00 a.m. to 8:29 a.m.
- 5578:30 a.m. to 8:59 a.m.
- 3079:00 a.m. to 9:59 a.m.
- 14110:00 a.m. to 10:59 a.m.
- 2311:00 a.m. to 11:59 a.m.
- 19112:00 p.m. to 3:59 p.m.
- 664:00 p.m. to 11:59 p.m.

Occupations of males:
- Percentage of males in management occupations (except farmers):
Here: 10.3% city: 12.9%
- Percentage of males in business and financial operations occupations:
Here: 5.0% city: 6.1%
- Percentage of males in computer and mathematical occupations:
Here: 6.6% city: 5.5%
- Percentage of males in architecture and engineering occupations:
Here: 2.3% city: 3.3%
- Percentage of males in education, training, and library occupations:
Here: 3.9% city: 3.3%
- Percentage of males in arts, design, entertainment, sports, and media occupations:
Here: 27.8% city: 18.9%
- Percentage of males in healthcare practitioners and technical occupations:
Here: 1.3% city: 3.0%
- Percentage of males in service occupations:
Here: 18.0% city: 11.2%
- Percentage of males in sales and office occupations:
Here: 13.5% city: 14.1%
- Percentage of males in construction, extraction, and maintenance occupations:
Here: 5.2% city: 3.7%
- Percentage of males in material moving occupations:
Here: 3.4% city: 1.8%
Occupations of females:
- Percentage of females in management occupations (except farmers):
Here: 8.9% city: 13.3%
- Percentage of females in business and financial operations occupations:
Here: 18.6% city: 8.3%
- Percentage of females in life, physical, and social science occupations:
Here: 1.9% city: 1.1%
- Percentage of females in community and social services occupations:
Here: 3.5% city: 2.2%
- Percentage of females in legal occupations:
Here: 1.1% city: 1.4%
- Percentage of females in education, training, and library occupations:
Here: 10.5% city: 7.5%
- Percentage of females in arts, design, entertainment, sports, and media occupations:
Here: 7.9% city: 11.3%
- Percentage of females in healthcare practitioners and technical occupations:
Here: 3.6% city: 7.1%
- Percentage of females in service occupations:
Here: 19.6% city: 17.4%
- Percentage of females in sales and office occupations:
Here: 17.7% city: 24.6%
- Percentage of females in production occupations:
Here: 4.9% city: 1.7%
Education in this neighborhood (subdivision or community):
- Percentage of people 3 years and older in K-12 schools:
McNeil: 20.2% Burbank: 13.3%
- Percentage of people 3 years and older in undergraduate colleges:
McNeil: 11.0% Burbank: 5.8%
- Percentage of people 3 years and older in grad. or professional schools:
McNeil: 1.5% Burbank: 2.1%
- Percentage of students K-12 enrolled in private schools:
McNeil: 40.6% Burbank: 10.0%
Percentage of population below poverty level:
| McNeil: | 5.6% |
| Burbank: | 9.5% |
Median year owner moved in (as recorded in 2022):
Median year renter moved in (as recorded in 2022):
| McNeil: | 2001 |
| Burbank: | 2005 |
Median year renter moved in (as recorded in 2022):
| McNeil: | 2015 |
| Burbank: | 2019 |
Percentage of married-couple families with both working:
| McNeil: | 128.4% |
| Burbank: | 68.2% |

- 70.7%Utility gas
- 24.5%Electricity
- 1.9%Solar energy
- 1.6%No fuel used
- 0.9%Bottled, tank, or LP gas
Limited-access highways (interstate or state) in this neighborhood:
Ventura Fwy (State Rte 134)
Length: 0.59 miles
Direction: E-W
Direction: E-W
Roads and streets:
W Oak St
Length: 1.18 miles
Direction: E-W
Address range: 2500 to 4099
Direction: E-W
Address range: 2500 to 4099
W Verdugo Ave
Length: 1.18 miles
Direction: E-W
Address range: 2500 to 4099
Direction: E-W
Address range: 2500 to 4099
W Alameda Ave
Length: 1.17 miles
Direction: E-W
Address range: 2500 to 4099
Direction: E-W
Address range: 2500 to 4099
W Clark Ave
Length: 1.17 miles
Directions: E-W, SW-NE
Address range: 2500 to 4099
Directions: E-W, SW-NE
Address range: 2500 to 4099
N California St
Length: 0.86 miles
Direction: SE-NW
Address range: 100 to 825
Direction: SE-NW
Address range: 100 to 825
N Hollywood Way
Length: 0.85 miles
Direction: SE-NW
Address range: 200 to 827
Direction: SE-NW
Address range: 200 to 827
N Avon St
Length: 0.81 miles
Directions: E-W, N-S, SE-NW
Address range: 200 to 825
Directions: E-W, N-S, SE-NW
Address range: 200 to 825
N Fairview St
Length: 0.79 miles
Directions: N-S, SE-NW, SW-NE
Address range: 100 to 723
Directions: N-S, SE-NW, SW-NE
Address range: 100 to 723
N Niagara St
Length: 0.76 miles
Directions: N-S, SE-NW
Address range: 100 to 725
Directions: N-S, SE-NW
Address range: 100 to 725
N Catalina St
Length: 0.73 miles
Direction: SE-NW
Address range: 100 to 725
Direction: SE-NW
Address range: 100 to 725
N Florence St
Length: 0.70 miles
Direction: SE-NW
Address range: 100 to 625
Direction: SE-NW
Address range: 100 to 625
Pass Ave (N Pass Ave)
Length: 0.69 miles
Directions: N-S, SE-NW
Address range: 241 to 799
Directions: N-S, SE-NW
Address range: 241 to 799
N Naomi St
Length: 0.66 miles
Direction: SE-NW
Address range: 100 to 625
Direction: SE-NW
Address range: 100 to 625
N Whitnall Hwy
Length: 0.64 miles
Directions: E-W, SE-NW
Address range: 100 to 799
Directions: E-W, SE-NW
Address range: 100 to 799
N Frederic St
Length: 0.63 miles
Direction: SE-NW
Address range: 100 to 625
Direction: SE-NW
Address range: 100 to 625
W Olive Ave
Length: 0.62 miles
Direction: SW-NE
Address range: 2500 to 3299
Direction: SW-NE
Address range: 2500 to 3299
N Lima St
Length: 0.60 miles
Direction: SE-NW
Address range: 116 to 825
Direction: SE-NW
Address range: 116 to 825
N Buena Vista St
Length: 0.56 miles
Direction: SE-NW
Address range: 20 to 599
Direction: SE-NW
Address range: 20 to 599
N Cordova St
Length: 0.56 miles
Directions: N-S, SE-NW
Address range: 200 to 825
Directions: N-S, SE-NW
Address range: 200 to 825
N Ontario St
Length: 0.54 miles
Directions: SE-NW, SW-NE
Address range: 100 to 723
Directions: SE-NW, SW-NE
Address range: 100 to 723
N Screenland Dr
Length: 0.52 miles
Directions: N-S, SE-NW
Address range: 200 to 825
Directions: N-S, SE-NW
Address range: 200 to 825
N Maple St
Length: 0.45 miles
Directions: N-S, SE-NW
Address range: 200 to 799
Directions: N-S, SE-NW
Address range: 200 to 799
Whitnall Hwy
Length: 0.32 miles
Direction: SE-NW
Direction: SE-NW
W Heffron Dr
Length: 0.30 miles
Direction: E-W
Address range: 3700 to 4099
Direction: E-W
Address range: 3700 to 4099
Kenwood St (N Kenwood St)
Length: 0.30 miles
Direction: SE-NW
Address range: 600 to 825
Direction: SE-NW
Address range: 600 to 825
Rosemary Ln
Length: 0.27 miles
Direction: SE-NW
Address range: 500 to 699
Direction: SE-NW
Address range: 500 to 699
S Buena Vista St
Length: 0.22 miles
Direction: SE-NW
Address range: 100 to 299
Direction: SE-NW
Address range: 100 to 299
N Kenwood St
Length: 0.22 miles
Directions: N-S, SE-NW
Address range: 200 to 399
Directions: N-S, SE-NW
Address range: 200 to 399
S Frederic St
Length: 0.19 miles
Direction: SE-NW
Address range: 100 to 299
Direction: SE-NW
Address range: 100 to 299
Willow St
Length: 0.15 miles
Directions: N-S, SE-NW, SW-NE
Address range: 2600 to 2799
Directions: N-S, SE-NW, SW-NE
Address range: 2600 to 2799
N Pass Ave
Length: 0.09 miles
Direction: SE-NW
Address range: 200 to 239
Direction: SE-NW
Address range: 200 to 239
S Naomi St
Length: 0.07 miles
Direction: SE-NW
Address range: 200 to 299
Direction: SE-NW
Address range: 200 to 299
Jacaranda Ave
Length: 0.07 miles
Direction: E-W
Address range: 3300 to 3399
Direction: E-W
Address range: 3300 to 3399
S Niagara St
Length: 0.06 miles
Direction: SE-NW
Address range: 100 to 199
Direction: SE-NW
Address range: 100 to 199
S Edison Blvd
Length: 0.06 miles
Directions: E-W, SE-NW
Address range: 200 to 245
Directions: E-W, SE-NW
Address range: 200 to 245
S Florence St
Length: 0.03 miles
Direction: SE-NW
Address range: 200 to 299
Direction: SE-NW
Address range: 200 to 299