Marlo Heights neighborhood in Falls Church, Virginia (VA), 22042, 22044 detailed profile
Settings
X


Business Search - 14 Million verified businesses
Area: 0.222 square miles
Population: 724
Population density:
| Marlo Heights: | 3,262 people per square mile |
| Falls Church: | 7,340 people per square mile |

- 49168.0%White
- 11515.9%Hispanic or Latino
- 588.0%Asian
- 324.4%Two or more races
- 192.6%Black
- 50.7%Some other race
- 20.3%American Indian

Median household income in 2022:
| Marlo Heights: | $194,653 |
| Falls Church: | $164,536 |
Distribution of median household income
![Distribution of median household income]()
- 9Less than $10,000
- 16$10,000 to $19,999
- 8$20,000 to $29,999
- 15$30,000 to $39,999
- 20$40,000 to $49,999
- 6$50,000 to $59,999
- 4$60,000 to $74,999
- 17$75,000 to $99,999
- 21$100,000 to $124,999
- 19$125,000 to $149,999
- 50$150,000 to $199,999
- 112$200,000 or more

Distribution of owner-occupied house/condo value
![Distribution of owner-occupied house/condo value]()
- 7Less than $50,000
- 2$50,000 to $99,999
- 2$100,000 to $149,999
- 10$200,000 to $249,999
- 6$250,000 to $299,999
- 10$300,000 to $399,999
- 8$400,000 to $499,999
- 56$500,000 to $749,999
- 96$750,000 to $999,999
- 57$1,000,000 or more

Distribution of rent paid by renters
![Distribution of rent paid by renters]()
- 3$1,000 to $1,249
- 5$1,250 to $1,499
- 8$1,500 to $1,999
- 38$2,000 or more

Median rent in 2022:
| Marlo Heights: | $2,432 |
| Falls Church: | $1,943 |
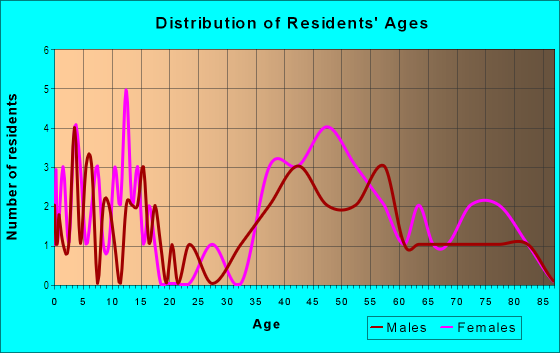
| Males: | 368 |
| Females: | 356 |
Males:
| This neighborhood: | 44.9 years |
| Whole city: | 36.7 years |
| This neighborhood: | 44.7 years |
| Whole city: | 41.5 years |
Average household size:
| Marlo Heights: | 10.2 people |
| Falls Church: | 2.5 people |
Percentage of family households:
| Marlo Heights: | 40.4% |
| Falls Church: | 46.0% |
| Here: | 60.9% |
| Falls Church: | 51.5% |
Percentage of married-couple families with children (among all households):
| Marlo Heights: | 30.7% |
| Falls Church: | 33.1% |
Percentage of single-mother households (among all households):
| Marlo Heights: | 2.0% |
| Falls Church: | 4.7% |
Percentage of never married males 15 years old and over:
Percentage of never married females 15 years old and over:
| Marlo Heights: | 20.0% |
| Falls Church: | 17.9% |
Percentage of never married females 15 years old and over:
| Marlo Heights: | 10.9% |
| city: | 16.2% |
Percentage of people that speak English not well or not at all:
| Marlo Heights: | 5.7% |
| Falls Church: | 2.2% |
Percentage of people born in this state:
Percentage of people born in another U.S. state:
Percentage of native residents but born outside the U.S.:
Percentage of foreign born residents:
| Here: | 24.4% |
| Falls Church: | 26.5% |
Percentage of people born in another U.S. state:
| Marlo Heights: | 53.1% |
| Falls Church: | 54.2% |
Percentage of native residents but born outside the U.S.:
| Here: | 4.9% |
| city: | 3.7% |
Percentage of foreign born residents:
| Here: | 17.6% |
| Falls Church: | 15.5% |

Owner-occupied
Renter-occupied


- Rooms in owner-occupied houses and condos in Marlo Heights
- 01 room
- 22 rooms
- 33 rooms
- 114 rooms
- 155 rooms
- 66 rooms
- 357 rooms
- 388 rooms
- 1179+ rooms

- Rooms in renter-occupied apartments in Marlo Heights
- 01 room
- 02 rooms
- 03 rooms
- 94 rooms
- 125 rooms
- 76 rooms
- 107 rooms
- 28 rooms
- 169+ rooms
Owner-occupied
Renter-occupied

- Bedrooms in owner-occupied houses and condos in Marlo Heights
- 0no bedroom
- 41 bedroom
- 92 bedrooms
- 703 bedrooms
- 774 bedrooms
- 655+ bedrooms

- Bedrooms in renter-occupied apartments in Marlo Heights
- 0no bedroom
- 41 bedroom
- 152 bedrooms
- 93 bedrooms
- 84 bedrooms
- 55+ bedrooms
Average number of cars or other vehicles available in houses/condos:
Average number of cars or other vehicles available in apartments:
| This neighborhood: | 2.5 |
| Falls Church: | 1.9 |
Average number of cars or other vehicles available in apartments:
| Here: | 1.7 |
| city: | 1.4 |
Percentage of units with a mortgage:
| Marlo Heights: | 62.1% |
| Falls Church: | 70.0% |
Average estimated value of detached houses in 2022 (98.8% of all units):
| Marlo Heights: | $967,739 |
| Virginia: | $472,865 |

- Year house built in Marlo Heights
- 02020 or later
- 62010 to 2019
- 72000 to 2009
- 31990 to 1999
- 111980 to 1989
- 91970 to 1979
- 251960 to 1969
- 1781950 to 1959
- 101940 to 1949
- 151939 or earlier

City-data.com crime index for city in 2020 (higher means more crime):
| City: | 120.0 |
| U.S. average: | 219.5 |
Travel time to work (commute)
![Travel time to work (commute)]()
- 2Less than 5 minutes
- 55 to 9 minutes
- 1310 to 14 minutes
- 2615 to 19 minutes
- 5120 to 24 minutes
- 2025 to 29 minutes
- 4030 to 34 minutes
- 1335 to 39 minutes
- 1140 to 44 minutes
- 2545 to 59 minutes
- 1760 to 89 minutes
- 790 or more minutes

Means of transportation to work
![Means of transportation to work]()
- 57.5%230Drove a car alone
- 7.0%28Carpooled
- 4.8%19Bus
- 3.5%14Subway or elevated rail
- 0.8%3Long-distance train or commuter rail
- 0.5%2Ferryboat
- 0.8%3Taxi
- 1.3%5Motorcycle
- 1.5%6Bicycle
- 0.5%2Walked
- 2.0%8Other means
- 29.3%117Worked at home

Time leaving home to go to work
![Time leaving home to go to work]()
- 512:00 a.m. to 4:59 a.m.
- 115:00 a.m. to 5:29 a.m.
- 185:30 a.m. to 5:59 a.m.
- 86:00 a.m. to 6:29 a.m.
- 176:30 a.m. to 6:59 a.m.
- 317:00 a.m. to 7:29 a.m.
- 277:30 a.m. to 7:59 a.m.
- 308:00 a.m. to 8:29 a.m.
- 308:30 a.m. to 8:59 a.m.
- 339:00 a.m. to 9:59 a.m.
- 510:00 a.m. to 10:59 a.m.
- 611:00 a.m. to 11:59 a.m.
- 712:00 p.m. to 3:59 p.m.
- 24:00 p.m. to 11:59 p.m.

Occupations of males:
- Percentage of males in management occupations (except farmers):
Here: 15.2% city: 24.7%
- Percentage of males in business and financial operations occupations:
Here: 10.5% city: 9.3%
- Percentage of males in computer and mathematical occupations:
Here: 6.7% city: 15.0%
- Percentage of males in architecture and engineering occupations:
Here: 4.4% city: 3.6%
- Percentage of males in life, physical, and social science occupations:
Here: 4.1% city: 3.7%
- Percentage of males in legal occupations:
Here: 5.1% city: 6.6%
- Percentage of males in arts, design, entertainment, sports, and media occupations:
Here: 1.2% city: 2.1%
- Percentage of males in healthcare practitioners and technical occupations:
Here: 2.3% city: 1.7%
- Percentage of males in service occupations:
Here: 12.7% city: 7.4%
- Percentage of males in sales and office occupations:
Here: 11.6% city: 12.4%
- Percentage of males in construction, extraction, and maintenance occupations:
Here: 18.2% city: 4.0%
- Percentage of males in transportation occupations:
Here: 2.2% city: 0.5%
Occupations of females:
- Percentage of females in management occupations (except farmers):
Here: 11.2% city: 15.1%
- Percentage of females in business and financial operations occupations:
Here: 20.3% city: 14.3%
- Percentage of females in computer and mathematical occupations:
Here: 5.8% city: 8.7%
- Percentage of females in architecture and engineering occupations:
Here: 1.7% city: 0.2%
- Percentage of females in life, physical, and social science occupations:
Here: 1.8% city: 2.7%
- Percentage of females in community and social services occupations:
Here: 4.5% city: 1.9%
- Percentage of females in legal occupations:
Here: 7.0% city: 4.6%
- Percentage of females in education, training, and library occupations:
Here: 5.6% city: 10.6%
- Percentage of females in arts, design, entertainment, sports, and media occupations:
Here: 9.4% city: 3.0%
- Percentage of females in healthcare practitioners and technical occupations:
Here: 6.2% city: 9.4%
- Percentage of females in service occupations:
Here: 8.2% city: 12.6%
- Percentage of females in sales and office occupations:
Here: 16.2% city: 15.9%
- Percentage of females in construction, extraction, and maintenance occupations:
Here: 2.2% city: 0.0%
Percentage of people 16-64 in Armed Forces:
| Marlo Heights: | 0.3% |
| Falls Church: | 1.3% |
Education in this neighborhood (subdivision or community):
- Percentage of people 3 years and older in K-12 schools:
Marlo Heights: 19.9% Falls Church: 21.3%
- Percentage of people 3 years and older in undergraduate colleges:
Marlo Heights: 2.0% Falls Church: 4.5%
- Percentage of people 3 years and older in grad. or professional schools:
Marlo Heights: 1.1% Falls Church: 2.0%
- Percentage of students K-12 enrolled in private schools:
Marlo Heights: 54.2% Falls Church: 11.0%
Percentage of population below poverty level:
| Marlo Heights: | 1.4% |
| Falls Church: | 2.3% |
Median year owner moved in (as recorded in 2022):
| Marlo Heights: | 2007 |
| Falls Church: | 2010 |
Percentage of married-couple families with both working:
| Marlo Heights: | 83.7% |
| Falls Church: | 77.3% |

- 81.0%Utility gas
- 14.7%Electricity
- 1.9%Fuel oil, kerosene, etc.
- 1.3%Coal or coke
- 1.1%Bottled, tank, or LP gas
Highways in this neighborhood:
Sleepy Hollow Rd (State Rte 613)
Length: 0.45 miles
Directions: N-S, SW-NE
Address range: 3200 to 3315
Directions: N-S, SW-NE
Address range: 3200 to 3315
Roads and streets:
Kerns Rd
Length: 0.32 miles
Directions: E-W, N-S, SE-NW
Address range: 6524 to 6599
Directions: E-W, N-S, SE-NW
Address range: 6524 to 6599
Goldsboro Rd
Length: 0.31 miles
Directions: E-W, N-S, SE-NW
Address range: 3300 to 6699
Directions: E-W, N-S, SE-NW
Address range: 3300 to 6699
Marlo Dr
Length: 0.23 miles
Directions: E-W, SE-NW
Address range: 6500 to 6599
Directions: E-W, SE-NW
Address range: 6500 to 6599
Queen Anne Ter
Length: 0.13 miles
Directions: E-W, SW-NE
Address range: 6400 to 6499
Directions: E-W, SW-NE
Address range: 6400 to 6499
Sleepy Ln
Length: 0.11 miles
Direction: N-S
Address range: 3300 to 3399
Direction: N-S
Address range: 3300 to 3399
Randall Pl
Length: 0.08 miles
Directions: E-W, SW-NE
Address range: 6500 to 6599
Directions: E-W, SW-NE
Address range: 6500 to 6599
Rutland Pl
Length: 0.07 miles
Direction: SW-NE
Address range: 6500 to 6599
Direction: SW-NE
Address range: 6500 to 6599
Clearwood Ct
Length: 0.07 miles
Directions: N-S, SE-NW
Address range: 3300 to 3312
Directions: N-S, SE-NW
Address range: 3300 to 3312
Goldsboro Pl
Length: 0.02 miles
Direction: SW-NE
Address range: 3300 to 3399
Direction: SW-NE
Address range: 3300 to 3399
Other features:
Tripps Run
Length: 0.01 miles
Direction: SW-NE
Direction: SW-NE