Marion Park neighborhood in Atlanta, Georgia (GA), 30337, 30344 detailed profile
Settings
X


Business Search - 14 Million verified businesses
Area: 0.184 square miles
Population: 635
Population density:
| Marion Park: | 3,443 people per square mile |
| Atlanta: | 3,788 people per square mile |

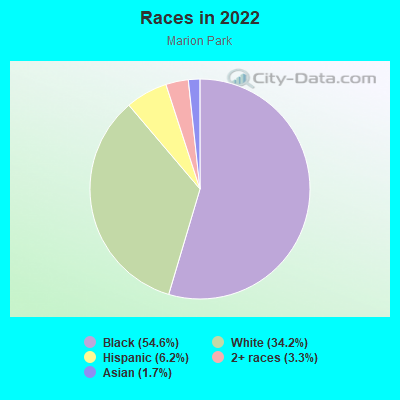
- 34554.6%Black
- 21634.2%White
- 396.2%Hispanic or Latino
- 213.3%Two or more races
- 111.7%Asian
Median household income in 2022:
| Marion Park: | $62,228 |
| Atlanta: | $83,251 |
Distribution of median household income
![Distribution of median household income]()
- 12Less than $10,000
- 15$10,000 to $19,999
- 39$20,000 to $29,999
- 32$30,000 to $39,999
- 43$40,000 to $49,999
- 25$50,000 to $59,999
- 62$60,000 to $74,999
- 83$75,000 to $99,999
- 103$100,000 to $124,999
- 24$125,000 to $149,999
- 13$150,000 to $199,999
- 4$200,000 or more

Distribution of owner-occupied house/condo value
![Distribution of owner-occupied house/condo value]()
- 6Less than $50,000
- 13$50,000 to $99,999
- 33$100,000 to $149,999
- 44$150,000 to $199,999
- 4$200,000 to $249,999
- 54$250,000 to $299,999
- 97$300,000 to $399,999
- 12$400,000 to $499,999
- 5$500,000 to $749,999
- 2$750,000 to $999,999
- 2$1,000,000 or more

Distribution of rent paid by renters
![Distribution of rent paid by renters]()
- 4Less than $100
- 3$100 to $199
- 18$200 to $299
- 2$300 to $399
- 4$400 to $499
- 28$500 to $599
- 12$600 to $699
- 83$700 to $799
- 22$800 to $899
- 12$900 to $999
- 41$1,000 to $1,249
- 50$1,250 to $1,499
- 30$1,500 to $1,999

Median rent in 2022:
| Marion Park: | $1,107 |
| Atlanta: | $1,477 |
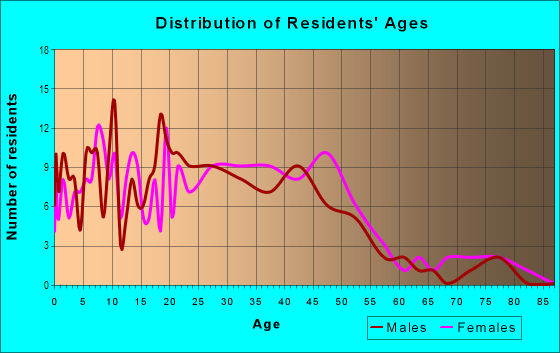
| Males: | 229 |
| Females: | 405 |
Males:
| This neighborhood: | 30.3 years |
| Whole city: | 33.7 years |
| This neighborhood: | 41.9 years |
| Whole city: | 34.3 years |
Average household size:
| Marion Park: | 11.3 people |
| Atlanta: | 2.0 people |
Percentage of family households:
| Marion Park: | 27.2% |
| Atlanta: | 31.6% |
| Here: | 16.6% |
| Atlanta: | 24.9% |
Percentage of married-couple families with children (among all households):
| Marion Park: | 25.6% |
| Atlanta: | 23.2% |
Percentage of single-mother households (among all households):
| Marion Park: | 161.6% |
| Atlanta: | 22.0% |
Percentage of never married males 15 years old and over:
Percentage of never married females 15 years old and over:
| Marion Park: | 14.8% |
| Atlanta: | 28.0% |
Percentage of never married females 15 years old and over:
| Marion Park: | 32.6% |
| city: | 26.3% |
Percentage of people that speak English not well or not at all:
| Marion Park: | 2.3% |
| Atlanta: | 1.0% |
Percentage of people born in this state:
Percentage of people born in another U.S. state:
Percentage of native residents but born outside the U.S.:
Percentage of foreign born residents:
| Here: | 61.0% |
| Atlanta: | 46.3% |
Percentage of people born in another U.S. state:
| Marion Park: | 29.8% |
| Atlanta: | 43.2% |
Percentage of native residents but born outside the U.S.:
| Here: | 2.2% |
| city: | 2.0% |
Percentage of foreign born residents:
| Here: | 6.9% |
| Atlanta: | 8.5% |
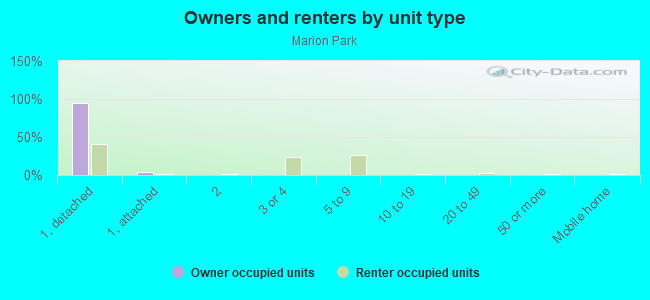
Owner-occupied
Renter-occupied

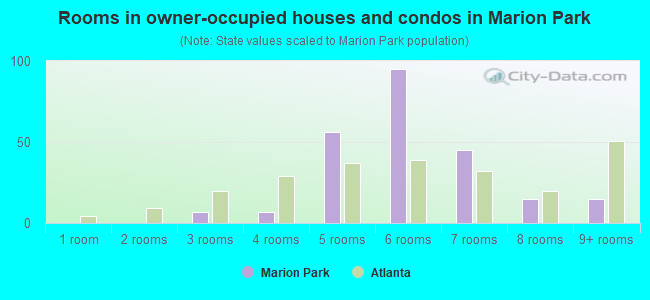
- Rooms in owner-occupied houses and condos in Marion Park
- 01 room
- 02 rooms
- 73 rooms
- 74 rooms
- 565 rooms
- 956 rooms
- 457 rooms
- 158 rooms
- 159+ rooms
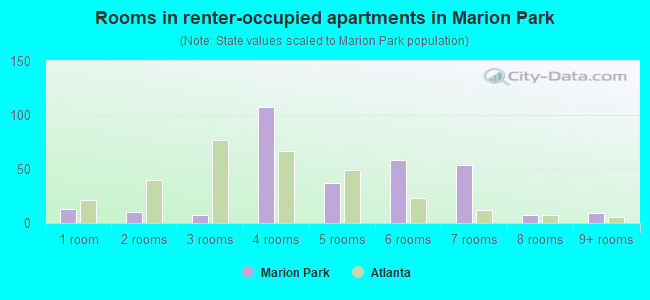
- Rooms in renter-occupied apartments in Marion Park
- 131 room
- 102 rooms
- 73 rooms
- 1074 rooms
- 375 rooms
- 586 rooms
- 547 rooms
- 78 rooms
- 99+ rooms
Owner-occupied
Renter-occupied
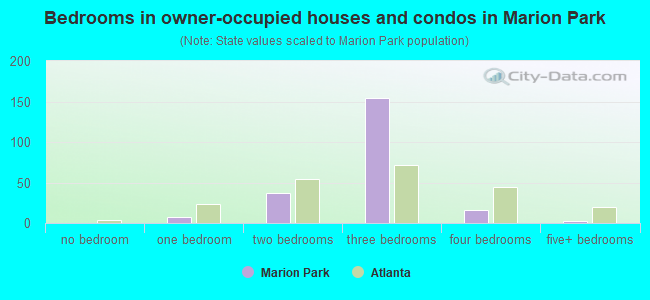
- Bedrooms in owner-occupied houses and condos in Marion Park
- 0no bedroom
- 71 bedroom
- 372 bedrooms
- 1543 bedrooms
- 164 bedrooms
- 35+ bedrooms
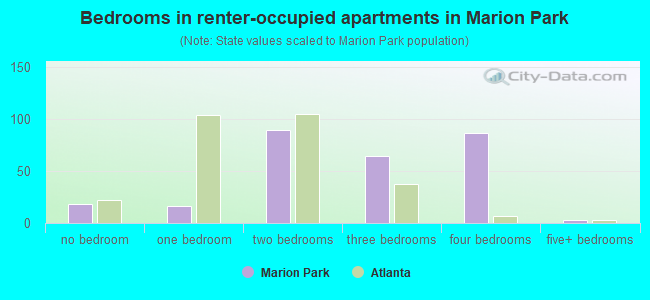
- Bedrooms in renter-occupied apartments in Marion Park
- 18no bedroom
- 161 bedroom
- 902 bedrooms
- 653 bedrooms
- 874 bedrooms
- 35+ bedrooms
Average number of cars or other vehicles available in houses/condos:
Average number of cars or other vehicles available in apartments:
| This neighborhood: | 1.7 |
| Atlanta: | 1.6 |
Average number of cars or other vehicles available in apartments:
| Here: | 1.4 |
| city: | 1.0 |
Percentage of units with a mortgage:
| Marion Park: | 80.9% |
| Atlanta: | 72.0% |
Average estimated value of detached houses in 2022 (86.3% of all units):
| Marion Park: | $276,849 |
| Atlanta: | $673,143 |
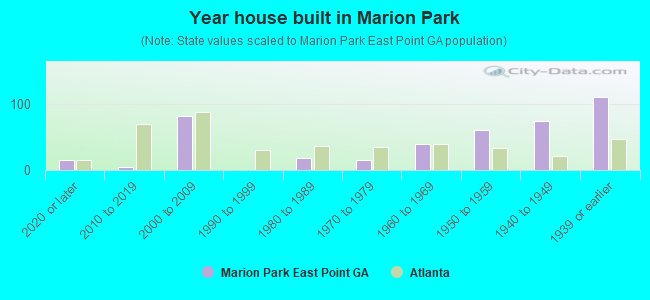
- Year house built in Marion Park
- 152020 or later
- 42010 to 2019
- 812000 to 2009
- 01990 to 1999
- 181980 to 1989
- 151970 to 1979
- 391960 to 1969
- 611950 to 1959
- 741940 to 1949
- 1101939 or earlier
City-data.com crime index for city in 2020 (higher means more crime):
| City: | 140.2 |
| U.S. average: | 219.5 |
Travel time to work (commute)
![Travel time to work (commute)]()
- 8Less than 5 minutes
- 155 to 9 minutes
- 1410 to 14 minutes
- 2015 to 19 minutes
- 4120 to 24 minutes
- 1625 to 29 minutes
- 3430 to 34 minutes
- 435 to 39 minutes
- 840 to 44 minutes
- 945 to 59 minutes
- 1460 to 89 minutes
- 590 or more minutes

Means of transportation to work
![Means of transportation to work]()
- 42.3%201Drove a car alone
- 5.5%26Carpooled
- 2.9%14Bus
- 30.1%143Subway or elevated rail
- 1.1%5Long-distance train or commuter rail
- 0.6%3Light rail, streetcar or trolley
- 5.7%27Taxi
- 0.8%4Motorcycle
- 2.9%14Walked
- 29.7%141Worked at home

Time leaving home to go to work
![Time leaving home to go to work]()
- 1312:00 a.m. to 4:59 a.m.
- 35:00 a.m. to 5:29 a.m.
- 15:30 a.m. to 5:59 a.m.
- 226:00 a.m. to 6:29 a.m.
- 326:30 a.m. to 6:59 a.m.
- 257:00 a.m. to 7:29 a.m.
- 97:30 a.m. to 7:59 a.m.
- 278:00 a.m. to 8:29 a.m.
- 138:30 a.m. to 8:59 a.m.
- 179:00 a.m. to 9:59 a.m.
- 1110:00 a.m. to 10:59 a.m.
- 511:00 a.m. to 11:59 a.m.
- 1112:00 p.m. to 3:59 p.m.
- 54:00 p.m. to 11:59 p.m.

Occupations of males:
- Percentage of males in management occupations (except farmers):
Here: 29.6% city: 16.5%
- Percentage of males in business and financial operations occupations:
Here: 5.3% city: 10.8%
- Percentage of males in architecture and engineering occupations:
Here: 2.6% city: 4.2%
- Percentage of males in education, training, and library occupations:
Here: 8.2% city: 5.1%
- Percentage of males in arts, design, entertainment, sports, and media occupations:
Here: 13.2% city: 4.8%
- Percentage of males in service occupations:
Here: 2.8% city: 11.5%
- Percentage of males in sales and office occupations:
Here: 10.0% city: 15.1%
- Percentage of males in construction, extraction, and maintenance occupations:
Here: 16.9% city: 2.4%
- Percentage of males in production occupations:
Here: 3.5% city: 1.9%
- Percentage of males in transportation occupations:
Here: 2.9% city: 4.0%
- Percentage of males in material moving occupations:
Here: 4.7% city: 4.3%
Occupations of females:
- Percentage of females in management occupations (except farmers):
Here: 31.0% city: 14.0%
- Percentage of females in business and financial operations occupations:
Here: 4.1% city: 10.8%
- Percentage of females in architecture and engineering occupations:
Here: 1.3% city: 1.4%
- Percentage of females in legal occupations:
Here: 14.8% city: 3.1%
- Percentage of females in education, training, and library occupations:
Here: 8.8% city: 8.9%
- Percentage of females in arts, design, entertainment, sports, and media occupations:
Here: 3.6% city: 4.9%
- Percentage of females in service occupations:
Here: 11.7% city: 13.9%
- Percentage of females in sales and office occupations:
Here: 11.2% city: 21.9%
- Percentage of females in production occupations:
Here: 6.1% city: 1.9%
- Percentage of females in material moving occupations:
Here: 7.0% city: 1.6%
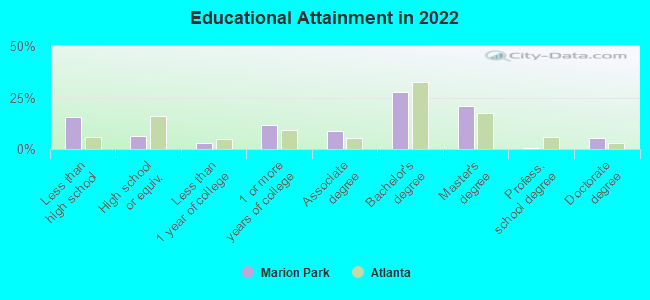
Education in this neighborhood (subdivision or community):
- Percentage of people 3 years and older in K-12 schools:
Marion Park: 13.5% Atlanta: 12.5%
- Percentage of people 3 years and older in undergraduate colleges:
Marion Park: 7.6% Atlanta: 8.9%
- Percentage of people 3 years and older in grad. or professional schools:
Marion Park: 6.3% Atlanta: 3.3%
- Percentage of students K-12 enrolled in private schools:
Marion Park: 17.6% Atlanta: 22.5%
Percentage of population below poverty level:
| Marion Park: | 23.2% |
| Atlanta: | 17.3% |
Median year owner moved in (as recorded in 2022):
Median year renter moved in (as recorded in 2022):
| Marion Park: | 2005 |
| Atlanta: | 2015 |
Median year renter moved in (as recorded in 2022):
| Marion Park: | 2018 |
| Atlanta: | 2020 |
Percentage of married-couple families with both working:
| Marion Park: | 114.2% |
| Atlanta: | 79.0% |
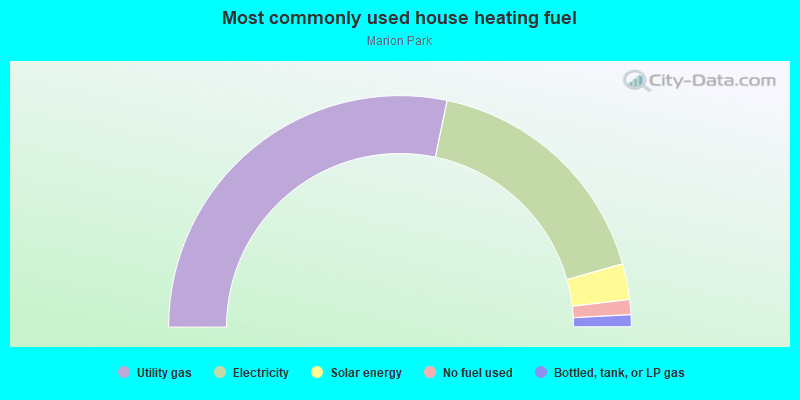
- 56.6%Utility gas
- 34.7%Electricity
- 5.0%Solar energy
- 2.1%No fuel used
- 1.7%Bottled, tank, or LP gas
Roads and streets:
Cloverhurst Dr
Length: 0.42 miles
Directions: N-S, SW-NE
Address range: 3000 to 3299
Directions: N-S, SW-NE
Address range: 3000 to 3299
Lyle Ave
Length: 0.36 miles
Directions: E-W, SW-NE
Address range: 1956 to 2143
Directions: E-W, SW-NE
Address range: 1956 to 2143
W Farris Ave
Length: 0.36 miles
Directions: E-W, SW-NE
Address range: 2001 to 2198
Directions: E-W, SW-NE
Address range: 2001 to 2198
Delowe Dr
Length: 0.35 miles
Directions: E-W, N-S
Address range: 3056 to 3205
Directions: E-W, N-S
Address range: 3056 to 3205
Washington Rd
Length: 0.35 miles
Directions: E-W, SW-NE
Address range: 3000 to 3070
Directions: E-W, SW-NE
Address range: 3000 to 3070
English Ln
Length: 0.27 miles
Directions: E-W, SE-NW, SW-NE
Address range: 1966 to 2071
Directions: E-W, SE-NW, SW-NE
Address range: 1966 to 2071
Larose St
Length: 0.27 miles
Direction: N-S
Address range: 3000 to 3199
Direction: N-S
Address range: 3000 to 3199
Cloverhurst Cir
Length: 0.16 miles
Directions: E-W, N-S, SW-NE
Address range: 3000 to 3199
Directions: E-W, N-S, SW-NE
Address range: 3000 to 3199
Pollard St
Length: 0.11 miles
Direction: N-S
Address range: 3100 to 3299
Direction: N-S
Address range: 3100 to 3299
Harris Dr
Length: 0.04 miles
Direction: N-S
Address range: 3201 to 3250
Direction: N-S
Address range: 3201 to 3250
Other features:
Camp Creek South Frk
Length: 0.22 miles
Direction: SW-NE
Direction: SW-NE