Magnolia Walk neighborhood in Woodstock, Georgia (GA), 30189 detailed profile
Settings
X


Business Search - 14 Million verified businesses
Area: 0.243 square miles
Population: 803
Population density:
| Magnolia Walk: | 3,310 people per square mile |
| Woodstock: | 3,991 people per square mile |

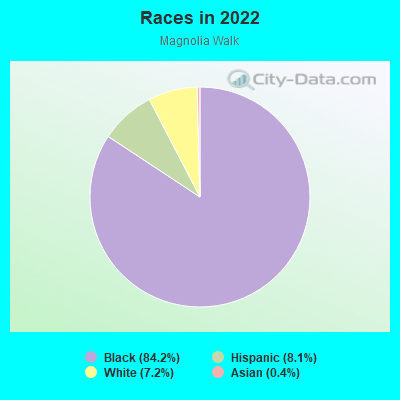
- 85484.2%Black
- 828.1%Hispanic or Latino
- 737.2%White
- 40.4%Asian
- 10.10%Two or more races
Median household income in 2022:
| Magnolia Walk: | $126,627 |
| Woodstock: | $100,913 |
Distribution of median household income
![Distribution of median household income]()
- 5Less than $10,000
- 11$10,000 to $19,999
- 22$20,000 to $29,999
- 61$30,000 to $39,999
- 36$40,000 to $49,999
- 40$50,000 to $59,999
- 14$60,000 to $74,999
- 20$75,000 to $99,999
- 76$100,000 to $124,999
- 30$125,000 to $149,999
- 24$150,000 to $199,999
- 16$200,000 or more

Distribution of owner-occupied house/condo value
![Distribution of owner-occupied house/condo value]()
- 36Less than $50,000
- 57$50,000 to $99,999
- 164$100,000 to $149,999
- 95$150,000 to $199,999
- 51$200,000 to $249,999
- 38$250,000 to $299,999
- 11$300,000 to $399,999
- 11$400,000 to $499,999
- 15$500,000 to $749,999
- 92$750,000 to $999,999
- 8$1,000,000 or more

Distribution of rent paid by renters
![Distribution of rent paid by renters]()
- 4$200 to $299
- 23$300 to $399
- 5$500 to $599
- 23$800 to $899
- 3$900 to $999
- 34$1,000 to $1,249
- 18$1,250 to $1,499
- 22$1,500 to $1,999
- 7$2,000 or more

Median rent in 2022:
| Magnolia Walk: | $1,398 |
| Woodstock: | $1,488 |
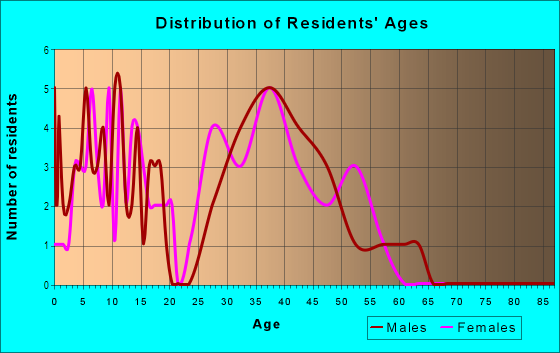
| Males: | 356 |
| Females: | 447 |
Males:
| This neighborhood: | 45.7 years |
| Whole city: | 36.7 years |
| This neighborhood: | 42.1 years |
| Whole city: | 36.1 years |
Average household size:
| Magnolia Walk: | 3.4 people |
| Woodstock: | 2.6 people |
Percentage of family households:
| Magnolia Walk: | 61.6% |
| Woodstock: | 54.1% |
| Here: | 33.1% |
| Woodstock: | 50.9% |
Percentage of married-couple families with children (among all households):
| Magnolia Walk: | 20.9% |
| Woodstock: | 30.7% |
Percentage of single-mother households (among all households):
| Magnolia Walk: | 15.7% |
| Woodstock: | 4.1% |
Percentage of never married males 15 years old and over:
Percentage of never married females 15 years old and over:
| Magnolia Walk: | 10.3% |
| Woodstock: | 13.8% |
Percentage of never married females 15 years old and over:
| Magnolia Walk: | 31.9% |
| city: | 16.7% |
Percentage of people that speak English not well or not at all:
| Magnolia Walk: | 0.0% |
| Woodstock: | 2.2% |
Percentage of people born in this state:
Percentage of people born in another U.S. state:
Percentage of native residents but born outside the U.S.:
Percentage of foreign born residents:
| Here: | 61.3% |
| Woodstock: | 40.7% |
Percentage of people born in another U.S. state:
| Magnolia Walk: | 30.4% |
| Woodstock: | 47.7% |
Percentage of native residents but born outside the U.S.:
| Here: | 1.6% |
| city: | 0.9% |
Percentage of foreign born residents:
| Here: | 6.7% |
| Woodstock: | 10.7% |
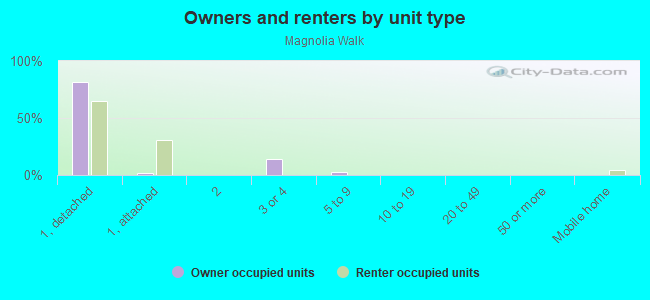
Owner-occupied
Renter-occupied

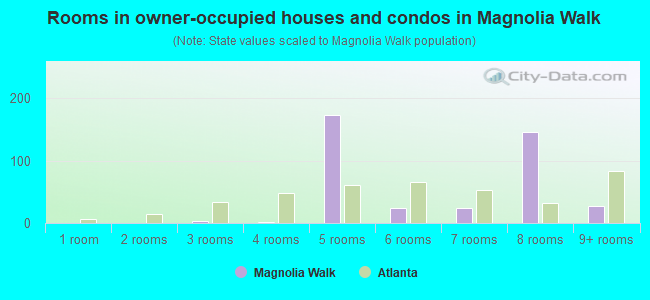
- Rooms in owner-occupied houses and condos in Magnolia Walk
- 01 room
- 02 rooms
- 33 rooms
- 14 rooms
- 1735 rooms
- 246 rooms
- 247 rooms
- 1468 rooms
- 289+ rooms
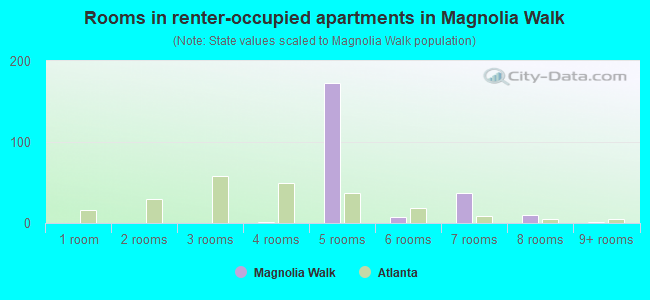
- Rooms in renter-occupied apartments in Magnolia Walk
- 01 room
- 02 rooms
- 03 rooms
- 14 rooms
- 1735 rooms
- 76 rooms
- 377 rooms
- 108 rooms
- 19+ rooms
Owner-occupied
Renter-occupied
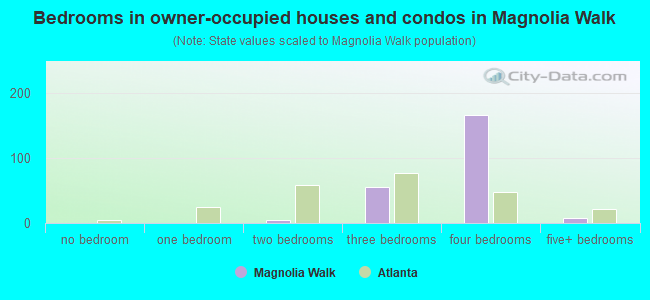
- Bedrooms in owner-occupied houses and condos in Magnolia Walk
- 0no bedroom
- 01 bedroom
- 52 bedrooms
- 553 bedrooms
- 1664 bedrooms
- 85+ bedrooms
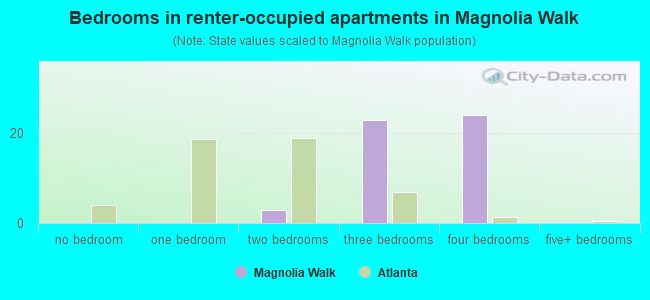
- Bedrooms in renter-occupied apartments in Magnolia Walk
- 0no bedroom
- 01 bedroom
- 32 bedrooms
- 233 bedrooms
- 244 bedrooms
- 05+ bedrooms
Average number of cars or other vehicles available in houses/condos:
Average number of cars or other vehicles available in apartments:
| This neighborhood: | 2.6 |
| Woodstock: | 2.1 |
Average number of cars or other vehicles available in apartments:
| Here: | 1.0 |
| city: | 1.5 |
Percentage of units with a mortgage:
| Magnolia Walk: | 83.2% |
| Woodstock: | 83.5% |
Average estimated value of detached houses in 2022 (99.6% of all units):
| Magnolia Walk: | $209,694 |
| Woodstock: | $396,296 |
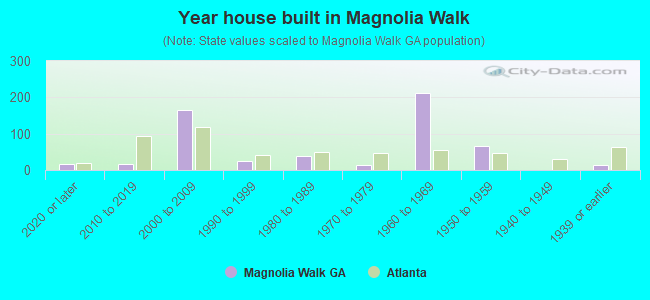
- Year house built in Magnolia Walk
- 172020 or later
- 162010 to 2019
- 1652000 to 2009
- 261990 to 1999
- 381980 to 1989
- 131970 to 1979
- 2111960 to 1969
- 651950 to 1959
- 01940 to 1949
- 131939 or earlier
City-data.com crime index for city in 2020 (higher means more crime):
| City: | 89.6 |
| U.S. average: | 219.5 |
Travel time to work (commute)
![Travel time to work (commute)]()
- 70Less than 5 minutes
- 155 to 9 minutes
- 11610 to 14 minutes
- 20015 to 19 minutes
- 20720 to 24 minutes
- 6625 to 29 minutes
- 28930 to 34 minutes
- 3535 to 39 minutes
- 26040 to 44 minutes
- 7745 to 59 minutes
- 8560 to 89 minutes
- 3390 or more minutes

Means of transportation to work
![Means of transportation to work]()
- 75.8%322Drove a car alone
- 9.2%39Carpooled
- 45.2%192Bus
- 0.7%3Subway or elevated rail
- 6.1%26Long-distance train or commuter rail
- 0.9%4Taxi
- 1.2%5Walked
- 2.1%9Other means
- 14.6%62Worked at home

Time leaving home to go to work
![Time leaving home to go to work]()
- 5112:00 a.m. to 4:59 a.m.
- 795:00 a.m. to 5:29 a.m.
- 495:30 a.m. to 5:59 a.m.
- 1146:00 a.m. to 6:29 a.m.
- 2006:30 a.m. to 6:59 a.m.
- 3807:00 a.m. to 7:29 a.m.
- 1517:30 a.m. to 7:59 a.m.
- 2288:00 a.m. to 8:29 a.m.
- 408:30 a.m. to 8:59 a.m.
- 1669:00 a.m. to 9:59 a.m.
- 1010:00 a.m. to 10:59 a.m.
- 1111:00 a.m. to 11:59 a.m.
- 9712:00 p.m. to 3:59 p.m.
- 564:00 p.m. to 11:59 p.m.

Occupations of males:
- Percentage of males in management occupations (except farmers):
Here: 11.6% city: 14.8%
- Percentage of males in business and financial operations occupations:
Here: 5.2% city: 10.7%
- Percentage of males in computer and mathematical occupations:
Here: 2.2% city: 7.3%
- Percentage of males in legal occupations:
Here: 11.2% city: 0.7%
- Percentage of males in arts, design, entertainment, sports, and media occupations:
Here: 5.1% city: 4.1%
- Percentage of males in service occupations:
Here: 5.3% city: 11.4%
- Percentage of males in sales and office occupations:
Here: 2.3% city: 18.2%
- Percentage of males in construction, extraction, and maintenance occupations:
Here: 4.9% city: 8.2%
- Percentage of males in production occupations:
Here: 5.8% city: 3.7%
- Percentage of males in transportation occupations:
Here: 39.7% city: 1.3%
- Percentage of males in material moving occupations:
Here: 49.0% city: 4.2%
Occupations of females:
- Percentage of females in management occupations (except farmers):
Here: 6.8% city: 16.4%
- Percentage of females in business and financial operations occupations:
Here: 4.4% city: 9.9%
- Percentage of females in computer and mathematical occupations:
Here: 10.7% city: 4.1%
- Percentage of females in community and social services occupations:
Here: 16.3% city: 2.0%
- Percentage of females in education, training, and library occupations:
Here: 23.2% city: 15.0%
- Percentage of females in healthcare practitioners and technical occupations:
Here: 6.9% city: 7.6%
- Percentage of females in service occupations:
Here: 3.4% city: 15.2%
- Percentage of females in sales and office occupations:
Here: 23.8% city: 22.2%
- Percentage of females in production occupations:
Here: 4.0% city: 1.0%
- Percentage of females in transportation occupations:
Here: 5.0% city: 1.1%
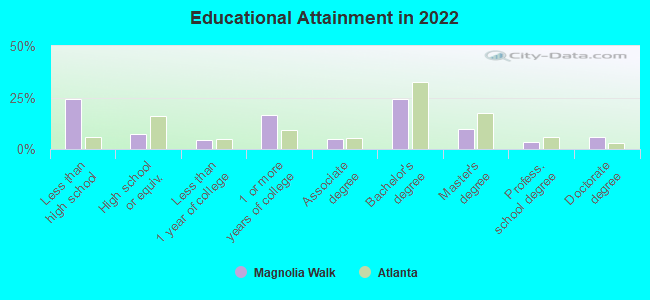
Education in this neighborhood (subdivision or community):
- Percentage of people 3 years and older in K-12 schools:
Magnolia Walk: 21.6% Woodstock: 18.6%
- Percentage of people 3 years and older in undergraduate colleges:
Magnolia Walk: 4.6% Woodstock: 5.6%
- Percentage of people 3 years and older in grad. or professional schools:
Magnolia Walk: 7.4% Woodstock: 1.8%
- Percentage of students K-12 enrolled in private schools:
Magnolia Walk: 24.7% Woodstock: 17.1%
Percentage of population below poverty level:
| Magnolia Walk: | 18.0% |
| Woodstock: | 5.9% |
Median year owner moved in (as recorded in 2022):
Median year renter moved in (as recorded in 2022):
| Magnolia Walk: | 2333 |
| Woodstock: | 2013 |
Median year renter moved in (as recorded in 2022):
| Magnolia Walk: | 2338 |
| Woodstock: | 2018 |
Percentage of married-couple families with both working:
| Magnolia Walk: | 93.3% |
| Woodstock: | 76.3% |
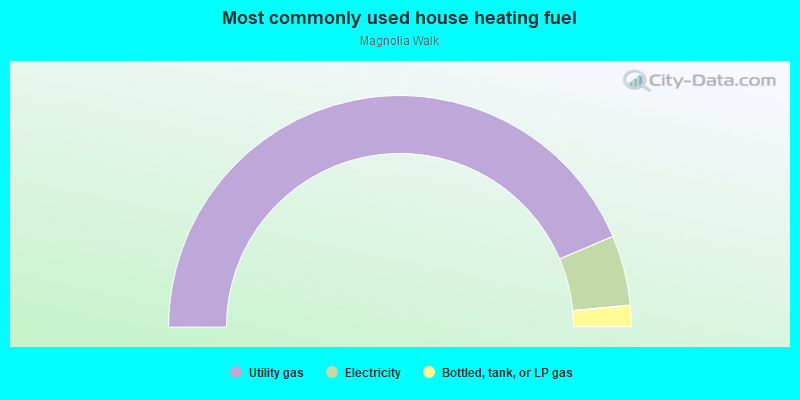
- 87.2%Utility gas
- 9.8%Electricity
- 3.0%Bottled, tank, or LP gas
Roads and streets:
Cedar Mill Ln
Length: 0.81 miles
Directions: E-W, N-S, SE-NW, SW-NE
Address range: 200 to 299
Directions: E-W, N-S, SE-NW, SW-NE
Address range: 200 to 299
N Briar Ridge
Length: 0.74 miles
Directions: N-S, SE-NW
Address range: 258 to 329
Directions: N-S, SE-NW
Address range: 258 to 329
Walnut Dr
Length: 0.55 miles
Directions: E-W, N-S, SE-NW, SW-NE
Address range: 300 to 499
Directions: E-W, N-S, SE-NW, SW-NE
Address range: 300 to 499
Black Oak Trl
Length: 0.44 miles
Directions: N-S, SW-NE
Address range: 100 to 199
Directions: N-S, SW-NE
Address range: 100 to 199
Wood Ridge Dr
Length: 0.22 miles
Directions: E-W, SE-NW
Address range: 600 to 699
Directions: E-W, SE-NW
Address range: 600 to 699
Chestnut Ridge
Length: 0.11 miles
Direction: SW-NE
Address range: 500 to 599
Direction: SW-NE
Address range: 500 to 599
Willow Brook Ln
Length: 0.07 miles
Directions: N-S, SW-NE
Address range: 600 to 799
Directions: N-S, SW-NE
Address range: 600 to 799
Oak Trce
Length: 0.05 miles
Direction: SW-NE
Address range: 800 to 899
Direction: SW-NE
Address range: 800 to 899