Lyric Place neighborhood in Monrovia, California (CA), 91016 detailed profile
Settings
X


Business Search - 14 Million verified businesses
Area: 0.082 square miles
Population: 474
Population density:
| Lyric Place: | 5,786 people per square mile |
| Monrovia: | 2,739 people per square mile |

- 24049.0%White
- 9218.8%Hispanic or Latino
- 5611.4%Asian
- 479.6%Two or more races
- 418.4%Native Hawaiian and Other
Pacific Islander - 91.8%Black
- 51.0%Some other race

Median household income in 2022:
| Lyric Place: | $107,160 |
| Monrovia: | $93,827 |
Distribution of median household income
![Distribution of median household income]()
- 8Less than $10,000
- 33$10,000 to $19,999
- 7$20,000 to $29,999
- 20$30,000 to $39,999
- 22$40,000 to $49,999
- 3$50,000 to $59,999
- 8$60,000 to $74,999
- 29$75,000 to $99,999
- 19$100,000 to $124,999
- 24$125,000 to $149,999
- 15$150,000 to $199,999
- 57$200,000 or more

Distribution of owner-occupied house/condo value
![Distribution of owner-occupied house/condo value]()
- 6Less than $50,000
- 6$100,000 to $149,999
- 7$400,000 to $499,999
- 21$500,000 to $749,999
- 68$750,000 to $999,999
- 43$1,000,000 or more

Distribution of rent paid by renters
![Distribution of rent paid by renters]()
- 2$300 to $399
- 1$900 to $999
- 7$1,000 to $1,249
- 11$1,250 to $1,499
- 43$1,500 to $1,999
- 39$2,000 or more

Median rent in 2022:
| Lyric Place: | $1,863 |
| Monrovia: | $1,836 |
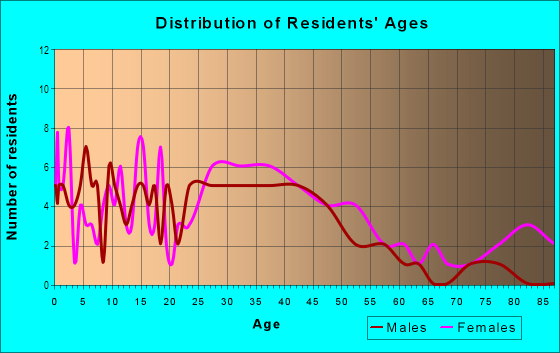
| Males: | 233 |
| Females: | 240 |
Males:
| This neighborhood: | 46.3 years |
| Whole city: | 36.5 years |
| This neighborhood: | 45.0 years |
| Whole city: | 39.9 years |
Average household size:
| Lyric Place: | 2.5 people |
| Monrovia: | 2.8 people |
Percentage of family households:
| Lyric Place: | 47.2% |
| Monrovia: | 50.1% |
| Here: | 42.0% |
| Monrovia: | 44.8% |
Percentage of married-couple families with children (among all households):
| Lyric Place: | 27.1% |
| Monrovia: | 26.4% |
Percentage of single-mother households (among all households):
| Lyric Place: | 11.5% |
| Monrovia: | 6.7% |
Percentage of never married males 15 years old and over:
Percentage of never married females 15 years old and over:
| Lyric Place: | 13.8% |
| Monrovia: | 20.0% |
Percentage of never married females 15 years old and over:
| Lyric Place: | 14.4% |
| city: | 17.2% |
Percentage of people that speak English not well or not at all:
| Lyric Place: | 0.4% |
| Monrovia: | 4.8% |
Percentage of people born in this state:
Percentage of people born in another U.S. state:
Percentage of native residents but born outside the U.S.:
Percentage of foreign born residents:
| Here: | 58.1% |
| Monrovia: | 60.6% |
Percentage of people born in another U.S. state:
| Lyric Place: | 21.3% |
| Monrovia: | 13.3% |
Percentage of native residents but born outside the U.S.:
| Here: | 0.9% |
| city: | 0.8% |
Percentage of foreign born residents:
| Here: | 19.7% |
| Monrovia: | 25.2% |

Owner-occupied
Renter-occupied


- Rooms in owner-occupied houses and condos in Lyric Place
- 01 room
- 72 rooms
- 133 rooms
- 144 rooms
- 365 rooms
- 236 rooms
- 227 rooms
- 178 rooms
- 179+ rooms

- Rooms in renter-occupied apartments in Lyric Place
- 21 room
- 102 rooms
- 193 rooms
- 224 rooms
- 105 rooms
- 156 rooms
- 47 rooms
- 88 rooms
- 59+ rooms
Owner-occupied
Renter-occupied
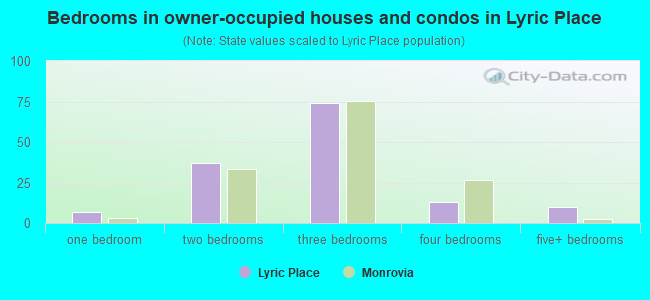
- Bedrooms in owner-occupied houses and condos in Lyric Place
- 0no bedroom
- 71 bedroom
- 372 bedrooms
- 743 bedrooms
- 134 bedrooms
- 105+ bedrooms

- Bedrooms in renter-occupied apartments in Lyric Place
- 2no bedroom
- 161 bedroom
- 232 bedrooms
- 173 bedrooms
- 44 bedrooms
- 155+ bedrooms
Average number of cars or other vehicles available in houses/condos:
Average number of cars or other vehicles available in apartments:
| This neighborhood: | 2.3 |
| Monrovia: | 2.2 |
Average number of cars or other vehicles available in apartments:
| Here: | 1.4 |
| city: | 1.8 |
Percentage of units with a mortgage:
| Lyric Place: | 82.5% |
| Monrovia: | 65.1% |

- Year house built in Lyric Place
- 02020 or later
- 12010 to 2019
- 102000 to 2009
- 41990 to 1999
- 161980 to 1989
- 371970 to 1979
- 231960 to 1969
- 601950 to 1959
- 601940 to 1949
- 931939 or earlier

City-data.com crime index for city in 2020 (higher means more crime):
| City: | 183.5 |
| U.S. average: | 219.5 |
Travel time to work (commute)
![Travel time to work (commute)]()
- 5Less than 5 minutes
- 155 to 9 minutes
- 2210 to 14 minutes
- 2915 to 19 minutes
- 1020 to 24 minutes
- 1325 to 29 minutes
- 2630 to 34 minutes
- 635 to 39 minutes
- 1040 to 44 minutes
- 4545 to 59 minutes
- 2660 to 89 minutes
- 1290 or more minutes

Means of transportation to work
![Means of transportation to work]()
- 80.9%208Drove a car alone
- 4.7%12Carpooled
- 0.8%2Subway or elevated rail
- 0.4%1Light rail, streetcar or trolley
- 0.4%1Motorcycle
- 0.8%2Walked
- 0.4%1Other means
- 16.7%43Worked at home

Time leaving home to go to work
![Time leaving home to go to work]()
- 412:00 a.m. to 4:59 a.m.
- 45:00 a.m. to 5:29 a.m.
- 155:30 a.m. to 5:59 a.m.
- 76:00 a.m. to 6:29 a.m.
- 196:30 a.m. to 6:59 a.m.
- 247:00 a.m. to 7:29 a.m.
- 217:30 a.m. to 7:59 a.m.
- 468:00 a.m. to 8:29 a.m.
- 238:30 a.m. to 8:59 a.m.
- 299:00 a.m. to 9:59 a.m.
- 710:00 a.m. to 10:59 a.m.
- 211:00 a.m. to 11:59 a.m.
- 912:00 p.m. to 3:59 p.m.
- 14:00 p.m. to 11:59 p.m.

Occupations of males:
- Percentage of males in management occupations (except farmers):
Here: 19.0% city: 12.7%
- Percentage of males in business and financial operations occupations:
Here: 10.2% city: 3.1%
- Percentage of males in computer and mathematical occupations:
Here: 2.1% city: 4.5%
- Percentage of males in architecture and engineering occupations:
Here: 4.7% city: 4.8%
- Percentage of males in life, physical, and social science occupations:
Here: 2.3% city: 1.4%
- Percentage of males in legal occupations:
Here: 2.2% city: 1.4%
- Percentage of males in education, training, and library occupations:
Here: 6.2% city: 5.1%
- Percentage of males in arts, design, entertainment, sports, and media occupations:
Here: 9.6% city: 4.2%
- Percentage of males in healthcare practitioners and technical occupations:
Here: 6.6% city: 4.5%
- Percentage of males in service occupations:
Here: 10.9% city: 13.0%
- Percentage of males in sales and office occupations:
Here: 22.3% city: 19.9%
- Percentage of males in construction, extraction, and maintenance occupations:
Here: 6.7% city: 10.7%
- Percentage of males in production occupations:
Here: 3.8% city: 4.8%
- Percentage of males in transportation occupations:
Here: 1.5% city: 4.1%
- Percentage of males in material moving occupations:
Here: 1.6% city: 2.7%
Occupations of females:
- Percentage of females in management occupations (except farmers):
Here: 21.3% city: 13.3%
- Percentage of females in business and financial operations occupations:
Here: 3.1% city: 5.5%
- Percentage of females in computer and mathematical occupations:
Here: 2.8% city: 2.4%
- Percentage of females in architecture and engineering occupations:
Here: 1.1% city: 0.4%
- Percentage of females in community and social services occupations:
Here: 1.3% city: 4.3%
- Percentage of females in legal occupations:
Here: 1.5% city: 1.1%
- Percentage of females in education, training, and library occupations:
Here: 13.1% city: 11.6%
- Percentage of females in arts, design, entertainment, sports, and media occupations:
Here: 16.5% city: 4.0%
- Percentage of females in healthcare practitioners and technical occupations:
Here: 12.9% city: 9.7%
- Percentage of females in service occupations:
Here: 12.8% city: 16.1%
- Percentage of females in sales and office occupations:
Here: 11.3% city: 26.0%
- Percentage of females in production occupations:
Here: 2.4% city: 2.5%
- Percentage of females in transportation occupations:
Here: 1.4% city: 0.9%
Education in this neighborhood (subdivision or community):
- Percentage of people 3 years and older in K-12 schools:
Lyric Place: 26.9% Monrovia: 16.9%
- Percentage of people 3 years and older in undergraduate colleges:
Lyric Place: 2.6% Monrovia: 5.6%
- Percentage of people 3 years and older in grad. or professional schools:
Lyric Place: 1.5% Monrovia: 2.0%
- Percentage of students K-12 enrolled in private schools:
Lyric Place: 0.8% Monrovia: 10.9%
Percentage of population below poverty level:
| Lyric Place: | 8.3% |
| Monrovia: | 10.1% |
Median year owner moved in (as recorded in 2022):
Median year renter moved in (as recorded in 2022):
| Lyric Place: | 2005 |
| Monrovia: | 2004 |
Median year renter moved in (as recorded in 2022):
| Lyric Place: | 2017 |
| Monrovia: | 2015 |
Percentage of married-couple families with both working:
| Lyric Place: | 81.4% |
| Monrovia: | 64.0% |

- 74.5%Utility gas
- 21.5%Electricity
- 2.8%Solar energy
- 1.3%Bottled, tank, or LP gas
Roads and streets:
E Foothill Blvd
Length: 0.34 miles
Direction: E-W
Address range: 130 to 399
Direction: E-W
Address range: 130 to 399
E Wildrose Ave
Length: 0.12 miles
Direction: E-W
Address range: 300 to 399
Direction: E-W
Address range: 300 to 399
S California Ave
Length: 0.11 miles
Direction: N-S
Address range: 100 to 247
Direction: N-S
Address range: 100 to 247
S Canyon Blvd
Length: 0.10 miles
Direction: N-S
Address range: 100 to 248
Direction: N-S
Address range: 100 to 248
N Canyon Blvd
Length: 0.09 miles
Direction: N-S
Address range: 100 to 147
Direction: N-S
Address range: 100 to 147
May Ave
Length: 0.02 miles
Direction: N-S
Address range: 100 to 111
Direction: N-S
Address range: 100 to 111