Lynwood neighborhood in Springfield, Virginia (VA), 22150 detailed profile
Settings
X


Business Search - 14 Million verified businesses
Area: 0.389 square miles
Population: 1,983
Population density:
| Lynwood: | 5,094 people per square mile |
| Springfield: | 3,180 people per square mile |

- 69234.3%Hispanic or Latino
- 49924.7%White
- 43021.3%Asian
- 33016.3%Black
- 341.7%Two or more races
- 301.5%Some other race
- 40.2%American Indian

Median household income in 2022:
| Lynwood: | $122,123 |
| Springfield: | $117,598 |
Distribution of median household income
![Distribution of median household income]()
- 20Less than $10,000
- 47$10,000 to $19,999
- 47$20,000 to $29,999
- 90$30,000 to $39,999
- 85$40,000 to $49,999
- 11$50,000 to $59,999
- 24$60,000 to $74,999
- 48$75,000 to $99,999
- 70$100,000 to $124,999
- 33$125,000 to $149,999
- 148$150,000 to $199,999
- 120$200,000 or more

Distribution of owner-occupied house/condo value
![Distribution of owner-occupied house/condo value]()
- 46Less than $50,000
- 15$50,000 to $99,999
- 7$100,000 to $149,999
- 17$150,000 to $199,999
- 37$200,000 to $249,999
- 18$250,000 to $299,999
- 20$300,000 to $399,999
- 123$400,000 to $499,999
- 279$500,000 to $749,999
- 43$750,000 to $999,999
- 84$1,000,000 or more

Distribution of rent paid by renters
![Distribution of rent paid by renters]()
- 17$200 to $299
- 21$400 to $499
- 8$500 to $599
- 7$900 to $999
- 8$1,000 to $1,249
- 44$1,250 to $1,499
- 35$1,500 to $1,999
- 113$2,000 or more

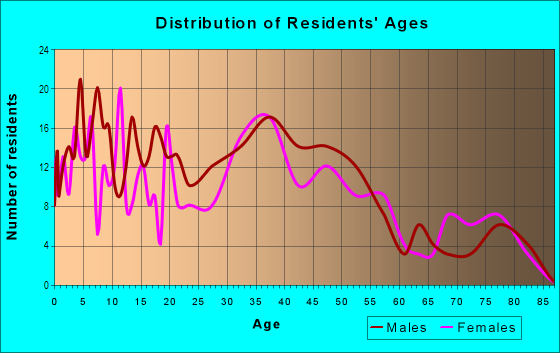
| Males: | 1,067 |
| Females: | 915 |
Males:
| This neighborhood: | 38.9 years |
| Whole city: | 41.7 years |
| This neighborhood: | 38.4 years |
| Whole city: | 41.9 years |
Average household size:
| Lynwood: | 9.1 people |
| Springfield: | 2.9 people |
Percentage of family households:
| Lynwood: | 59.3% |
| Springfield: | 43.2% |
| Here: | 52.9% |
| Springfield: | 53.4% |
Percentage of married-couple families with children (among all households):
| Lynwood: | 20.2% |
| Springfield: | 28.0% |
Percentage of single-mother households (among all households):
| Lynwood: | 6.8% |
| Springfield: | 3.9% |
Percentage of never married males 15 years old and over:
Percentage of never married females 15 years old and over:
| Lynwood: | 22.3% |
| Springfield: | 18.7% |
Percentage of never married females 15 years old and over:
| Lynwood: | 16.6% |
| place: | 14.4% |
Percentage of people that speak English not well or not at all:
| Lynwood: | 15.7% |
| Springfield: | 10.7% |
Percentage of people born in this state:
Percentage of people born in another U.S. state:
Percentage of native residents but born outside the U.S.:
Percentage of foreign born residents:
| Here: | 34.4% |
| Springfield: | 29.6% |
Percentage of people born in another U.S. state:
| Lynwood: | 16.5% |
| Springfield: | 25.8% |
Percentage of native residents but born outside the U.S.:
| Here: | 3.2% |
| place: | 4.0% |
Percentage of foreign born residents:
| Here: | 45.9% |
| Springfield: | 40.6% |

Owner-occupied
Renter-occupied


- Rooms in owner-occupied houses and condos in Lynwood
- 01 room
- 132 rooms
- 03 rooms
- 404 rooms
- 305 rooms
- 1556 rooms
- 1227 rooms
- 318 rooms
- 1039+ rooms

- Rooms in renter-occupied apartments in Lynwood
- 131 room
- 142 rooms
- 333 rooms
- 814 rooms
- 185 rooms
- 796 rooms
- 127 rooms
- 138 rooms
- 49+ rooms
Owner-occupied
Renter-occupied

- Bedrooms in owner-occupied houses and condos in Lynwood
- 0no bedroom
- 131 bedroom
- 152 bedrooms
- 2673 bedrooms
- 1184 bedrooms
- 785+ bedrooms

- Bedrooms in renter-occupied apartments in Lynwood
- 13no bedroom
- 141 bedroom
- 1332 bedrooms
- 213 bedrooms
- 204 bedrooms
- 155+ bedrooms
Average number of cars or other vehicles available in houses/condos:
Average number of cars or other vehicles available in apartments:
| This neighborhood: | 2.5 |
| Springfield: | 2.2 |
Average number of cars or other vehicles available in apartments:
| Here: | 2.5 |
| place: | 1.4 |
Percentage of units with a mortgage:
| Lynwood: | 70.1% |
| Springfield: | 68.2% |
Average estimated value of detached houses in 2022 (89.8% of all units):
| Lynwood: | $778,534 |
| Virginia: | $472,865 |

- Year house built in Lynwood
- 12020 or later
- 242010 to 2019
- 152000 to 2009
- 131990 to 1999
- 151980 to 1989
- 391970 to 1979
- 831960 to 1969
- 4011950 to 1959
- 161940 to 1949
- 01939 or earlier

Travel time to work (commute)
![Travel time to work (commute)]()
- 2Less than 5 minutes
- 135 to 9 minutes
- 6410 to 14 minutes
- 5915 to 19 minutes
- 12120 to 24 minutes
- 6225 to 29 minutes
- 16730 to 34 minutes
- 3735 to 39 minutes
- 4140 to 44 minutes
- 12045 to 59 minutes
- 9060 to 89 minutes
- 1190 or more minutes

Means of transportation to work
![Means of transportation to work]()
- 61.2%591Drove a car alone
- 14.8%143Carpooled
- 7.8%75Bus
- 1.6%15Subway or elevated rail
- 11.0%106Long-distance train or commuter rail
- 0.7%7Taxi
- 2.2%21Motorcycle
- 8.6%83Walked
- 3.1%30Other means
- 6.5%63Worked at home

Time leaving home to go to work
![Time leaving home to go to work]()
- 1712:00 a.m. to 4:59 a.m.
- 515:00 a.m. to 5:29 a.m.
- 375:30 a.m. to 5:59 a.m.
- 946:00 a.m. to 6:29 a.m.
- 646:30 a.m. to 6:59 a.m.
- 1037:00 a.m. to 7:29 a.m.
- 557:30 a.m. to 7:59 a.m.
- 1298:00 a.m. to 8:29 a.m.
- 828:30 a.m. to 8:59 a.m.
- 419:00 a.m. to 9:59 a.m.
- 3010:00 a.m. to 10:59 a.m.
- 211:00 a.m. to 11:59 a.m.
- 5812:00 p.m. to 3:59 p.m.
- 234:00 p.m. to 11:59 p.m.

Occupations of males:
- Percentage of males in management occupations (except farmers):
Here: 14.6% place: 14.1%
- Percentage of males in business and financial operations occupations:
Here: 3.1% place: 7.9%
- Percentage of males in computer and mathematical occupations:
Here: 11.2% place: 13.0%
- Percentage of males in architecture and engineering occupations:
Here: 4.7% place: 2.8%
- Percentage of males in life, physical, and social science occupations:
Here: 10.0% place: 1.8%
- Percentage of males in community and social services occupations:
Here: 1.2% place: 0.1%
- Percentage of males in healthcare practitioners and technical occupations:
Here: 1.1% place: 1.0%
- Percentage of males in service occupations:
Here: 15.3% place: 19.4%
- Percentage of males in sales and office occupations:
Here: 10.2% place: 10.6%
- Percentage of males in construction, extraction, and maintenance occupations:
Here: 11.0% place: 6.6%
- Percentage of males in production occupations:
Here: 4.4% place: 3.0%
- Percentage of males in transportation occupations:
Here: 9.2% place: 9.8%
Occupations of females:
- Percentage of females in management occupations (except farmers):
Here: 8.3% place: 8.7%
- Percentage of females in business and financial operations occupations:
Here: 2.3% place: 7.6%
- Percentage of females in computer and mathematical occupations:
Here: 5.1% place: 3.9%
- Percentage of females in life, physical, and social science occupations:
Here: 1.9% place: 1.0%
- Percentage of females in community and social services occupations:
Here: 1.6% place: 0.8%
- Percentage of females in legal occupations:
Here: 1.2% place: 0.7%
- Percentage of females in arts, design, entertainment, sports, and media occupations:
Here: 5.7% place: 1.6%
- Percentage of females in healthcare practitioners and technical occupations:
Here: 2.8% place: 8.9%
- Percentage of females in service occupations:
Here: 30.5% place: 29.3%
- Percentage of females in sales and office occupations:
Here: 36.7% place: 26.3%
- Percentage of females in production occupations:
Here: 2.6% place: 3.7%
Percentage of people 16-64 in Armed Forces:
| Lynwood: | 0.0% |
| Springfield: | 1.5% |
Education in this neighborhood (subdivision or community):
- Percentage of people 3 years and older in K-12 schools:
Lynwood: 12.9% Springfield: 13.6%
- Percentage of people 3 years and older in undergraduate colleges:
Lynwood: 3.8% Springfield: 6.6%
- Percentage of people 3 years and older in grad. or professional schools:
Lynwood: 1.2% Springfield: 1.3%
- Percentage of students K-12 enrolled in private schools:
Lynwood: 115.4% Springfield: 14.3%
Percentage of population below poverty level:
| Lynwood: | 7.2% |
| Springfield: | 7.2% |
Median year owner moved in (as recorded in 2022):
| Lynwood: | 2061 |
| Springfield: | 2006 |
Percentage of married-couple families with both working:
| Lynwood: | 69.8% |
| Springfield: | 66.9% |

- 58.9%Utility gas
- 22.6%Electricity
- 9.9%Bottled, tank, or LP gas
- 5.9%Fuel oil, kerosene, etc.
- 2.8%No fuel used
Limited-access highways (interstate or state) in this neighborhood:
I- 495 (Capital Beltway)
Length: 1.30 miles
Directions: E-W, SE-NW
Directions: E-W, SE-NW
I- 95 (I- 395, Henry G Shirley Memorial Hwy)
Length: 0.51 miles
Directions: E-W, SW-NE
Directions: E-W, SW-NE
Highways in this neighborhood:
State Rte 617 (Backlick Rd)
Length: 0.64 miles
Direction: N-S
Address range: 5727 to 6099
Direction: N-S
Address range: 5727 to 6099
Roads and streets:
Cabin John Rd
Length: 0.86 miles
Directions: E-W, N-S, SE-NW, SW-NE
Address range: 6700 to 6999
Directions: E-W, N-S, SE-NW, SW-NE
Address range: 6700 to 6999
Floyd Ave
Length: 0.65 miles
Directions: E-W, SE-NW, SW-NE
Address range: 6800 to 6999
Directions: E-W, SE-NW, SW-NE
Address range: 6800 to 6999
Essex Ave
Length: 0.57 miles
Directions: E-W, N-S, SW-NE
Address range: 6900 to 6999
Directions: E-W, N-S, SW-NE
Address range: 6900 to 6999
Highland St
Length: 0.53 miles
Directions: E-W, SE-NW
Address range: 6800 to 6999
Directions: E-W, SE-NW
Address range: 6800 to 6999
Amherst Ave
Length: 0.45 miles
Directions: N-S, SW-NE
Address range: 5800 to 6099
Directions: N-S, SW-NE
Address range: 5800 to 6099
Flanders St
Length: 0.43 miles
Directions: E-W, N-S, SE-NW, SW-NE
Address range: 5800 to 6099
Directions: E-W, N-S, SE-NW, SW-NE
Address range: 5800 to 6099
Augusta Dr
Length: 0.27 miles
Directions: N-S, SE-NW, SW-NE
Address range: 5900 to 6099
Directions: N-S, SE-NW, SW-NE
Address range: 5900 to 6099
Camberly Ave
Length: 0.26 miles
Directions: N-S, SE-NW
Address range: 5900 to 5999
Directions: N-S, SE-NW
Address range: 5900 to 5999
Inverness Dr
Length: 0.25 miles
Directions: E-W, SE-NW
Address range: 6800 to 6999
Directions: E-W, SE-NW
Address range: 6800 to 6999
Edgebrook Dr
Length: 0.21 miles
Direction: E-W
Address range: 6900 to 6999
Direction: E-W
Address range: 6900 to 6999
Gilbert St
Length: 0.19 miles
Directions: E-W, SW-NE
Address range: 6900 to 6999
Directions: E-W, SW-NE
Address range: 6900 to 6999
Channing Rd
Length: 0.17 miles
Directions: N-S, SW-NE
Address range: 5800 to 5899
Directions: N-S, SW-NE
Address range: 5800 to 5899
Lynnbrook Dr
Length: 0.16 miles
Direction: E-W
Address range: 6800 to 6899
Direction: E-W
Address range: 6800 to 6899
Dorchester St
Length: 0.13 miles
Directions: N-S, SE-NW
Address range: 6100 to 6199
Directions: N-S, SE-NW
Address range: 6100 to 6199
Clearbrook Dr
Length: 0.12 miles
Direction: N-S
Address range: 6100 to 6199
Direction: N-S
Address range: 6100 to 6199
Brandon Ave
Length: 0.11 miles
Directions: E-W, N-S, SE-NW
Address range: 6000 to 6099
Directions: E-W, N-S, SE-NW
Address range: 6000 to 6099
Danbury Rd
Length: 0.09 miles
Direction: SW-NE
Address range: 5800 to 5899
Direction: SW-NE
Address range: 5800 to 5899
Fox Hill St
Length: 0.08 miles
Direction: N-S
Address range: 6100 to 6199
Direction: N-S
Address range: 6100 to 6199
Edgerton Ln
Length: 0.08 miles
Direction: E-W
Address range: 6900 to 6999
Direction: E-W
Address range: 6900 to 6999
Other features:
Backlick Run
Length: 0.12 miles
Directions: E-W, N-S, SE-NW
Directions: E-W, N-S, SE-NW
Blacklik Run
Length: 0.01 miles
Direction: SE-NW
Direction: SE-NW