Lower Corridor neighborhood in Saint Charles, Illinois (IL), 60174 detailed profile
Settings
X


Area: 0.240 square miles
Population: 826
Population density: 3,445 people per square mile

- 61965.5%White
- 14915.8%Hispanic or Latino
- 616.5%Black
- 464.9%Two or more races
- 434.6%Asian
- 232.4%American Indian
- 40.4%Some other race

Median household income in 2022:
| Lower Corridor: | $99,077 |
| Illinois: | $76,708 |
Distribution of median household income
![Distribution of median household income]()
- 22Less than $10,000
- 295$10,000 to $19,999
- 249$20,000 to $29,999
- 107$30,000 to $39,999
- 110$40,000 to $49,999
- 37$50,000 to $59,999
- 55$60,000 to $74,999
- 53$75,000 to $99,999
- 67$100,000 to $124,999
- 71$125,000 to $149,999
- 36$150,000 to $199,999
- 19$200,000 or more

Distribution of owner-occupied house/condo value
![Distribution of owner-occupied house/condo value]()
- 66Less than $50,000
- 21$50,000 to $99,999
- 132$100,000 to $149,999
- 20$150,000 to $199,999
- 112$200,000 to $249,999
- 69$250,000 to $299,999
- 55$300,000 to $399,999
- 25$400,000 to $499,999
- 85$500,000 to $749,999
- 31$750,000 to $999,999

Distribution of rent paid by renters
![Distribution of rent paid by renters]()
- 24Less than $100
- 88$100 to $199
- 156$200 to $299
- 159$300 to $399
- 88$400 to $499
- 24$500 to $599
- 2$600 to $699
- 38$700 to $799
- 227$800 to $899
- 7$900 to $999
- 116$1,000 to $1,249
- 383$1,250 to $1,499
- 179$1,500 to $1,999
- 158$2,000 or more

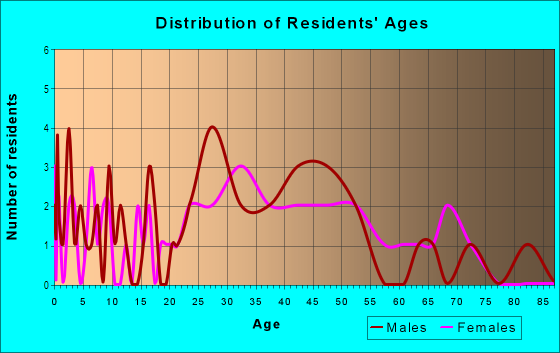
| Males: | 375 |
| Females: | 450 |
| Males: | 40.0 years |
| Females: | 43.7 years |
Average household size:
| Lower Corridor: | 2.3 people |
| Illinois: | 2.4 people |
Percentage of family households:
| Lower Corridor: | 23.8% |
| Illinois: | 44.2% |
| Here: | 35.7% |
| Illinois: | 45.1% |
Percentage of married-couple families with children (among all households):
| Lower Corridor: | 39.4% |
| Illinois: | 57.7% |
Percentage of single-mother households (among all households):
| Lower Corridor: | 118.7% |
| Illinois: | 9.3% |
Percentage of never married males 15 years old and over:
Percentage of never married females 15 years old and over:
| Lower Corridor: | 15.0% |
| Illinois: | 19.2% |
Percentage of never married females 15 years old and over:
| Lower Corridor: | 9.4% |
| Illinois: | 17.2% |
Percentage of people that speak English not well or not at all:
| Lower Corridor: | 0.7% |
| Illinois: | 3.9% |
Percentage of people born in this state:
Percentage of people born in another U.S. state:
Percentage of native residents but born outside the U.S.:
Percentage of foreign born residents:
| Here: | 70.9% |
| Illinois: | 66.6% |
Percentage of people born in another U.S. state:
| Lower Corridor: | 19.3% |
| Illinois: | 17.7% |
Percentage of native residents but born outside the U.S.:
| Here: | 1.6% |
| Illinois: | 1.3% |
Percentage of foreign born residents:
| Here: | 8.3% |
| Illinois: | 14.4% |

Owner-occupied
Renter-occupied


- Rooms in owner-occupied houses and condos in Lower Corridor
- 01 room
- 02 rooms
- 143 rooms
- 844 rooms
- 455 rooms
- 726 rooms
- 357 rooms
- 778 rooms
- 189+ rooms

- Rooms in renter-occupied apartments in Lower Corridor
- 231 room
- 742 rooms
- 5113 rooms
- 4154 rooms
- 2875 rooms
- 596 rooms
- 197 rooms
- 298 rooms
- 69+ rooms
Owner-occupied
Renter-occupied

- Bedrooms in owner-occupied houses and condos in Lower Corridor
- 0no bedroom
- 151 bedroom
- 462 bedrooms
- 1633 bedrooms
- 364 bedrooms
- 455+ bedrooms

- Bedrooms in renter-occupied apartments in Lower Corridor
- 23no bedroom
- 7871 bedroom
- 6192 bedrooms
- 193 bedrooms
- 214 bedrooms
- 05+ bedrooms
Average number of cars or other vehicles available in houses/condos:
Average number of cars or other vehicles available in apartments:
| This neighborhood: | 2.9 |
| Illinois: | 2.0 |
Average number of cars or other vehicles available in apartments:
| Here: | 7.3 |
| Illinois: | 1.1 |
Percentage of units with a mortgage:
| Lower Corridor: | 62.7% |
| Illinois: | 61.2% |
Average estimated value of detached houses in 2022 (60.8% of all units):
| Lower Corridor: | $244,398 |
| Illinois: | $310,164 |

- Year house built in Lower Corridor
- 372020 or later
- 122010 to 2019
- 492000 to 2009
- 301990 to 1999
- 841980 to 1989
- 731970 to 1979
- 741960 to 1969
- 691950 to 1959
- 321940 to 1949
- 531939 or earlier

Travel time to work (commute)
![Travel time to work (commute)]()
- 18Less than 5 minutes
- 1165 to 9 minutes
- 11110 to 14 minutes
- 8815 to 19 minutes
- 3920 to 24 minutes
- 4025 to 29 minutes
- 8630 to 34 minutes
- 3535 to 39 minutes
- 3240 to 44 minutes
- 10345 to 59 minutes
- 4960 to 89 minutes
- 2090 or more minutes

Means of transportation to work
![Means of transportation to work]()
- 85.8%450Drove a car alone
- 3.8%20Carpooled
- 5.0%26Bus
- 5.9%31Long-distance train or commuter rail
- 5.3%28Motorcycle
- 1.9%10Bicycle
- 29.3%154Walked
- 0.2%1Other means
- 3.8%20Worked at home

Time leaving home to go to work
![Time leaving home to go to work]()
- 4512:00 a.m. to 4:59 a.m.
- 475:00 a.m. to 5:29 a.m.
- 195:30 a.m. to 5:59 a.m.
- 626:00 a.m. to 6:29 a.m.
- 746:30 a.m. to 6:59 a.m.
- 927:00 a.m. to 7:29 a.m.
- 857:30 a.m. to 7:59 a.m.
- 428:00 a.m. to 8:29 a.m.
- 358:30 a.m. to 8:59 a.m.
- 499:00 a.m. to 9:59 a.m.
- 1010:00 a.m. to 10:59 a.m.
- 511:00 a.m. to 11:59 a.m.
- 7612:00 p.m. to 3:59 p.m.
- 494:00 p.m. to 11:59 p.m.

Occupations of males:
- Percentage of males in management occupations (except farmers):
Here: 5.6% Illinois: 12.5%
- Percentage of males in business and financial operations occupations:
Here: 5.7% Illinois: 5.8%
- Percentage of males in architecture and engineering occupations:
Here: 4.4% Illinois: 3.0%
- Percentage of males in community and social services occupations:
Here: 1.4% Illinois: 1.0%
- Percentage of males in education, training, and library occupations:
Here: 3.1% Illinois: 3.3%
- Percentage of males in healthcare practitioners and technical occupations:
Here: 5.1% Illinois: 2.8%
- Percentage of males in service occupations:
Here: 11.0% Illinois: 13.3%
- Percentage of males in sales and office occupations:
Here: 23.2% Illinois: 14.7%
- Percentage of males in construction, extraction, and maintenance occupations:
Here: 12.5% Illinois: 7.6%
- Percentage of males in production occupations:
Here: 16.1% Illinois: 8.2%
- Percentage of males in transportation occupations:
Here: 6.4% Illinois: 6.9%
Occupations of females:
- Percentage of females in management occupations (except farmers):
Here: 6.7% Illinois: 9.7%
- Percentage of females in business and financial operations occupations:
Here: 1.8% Illinois: 7.3%
- Percentage of females in computer and mathematical occupations:
Here: 1.0% Illinois: 1.9%
- Percentage of females in life, physical, and social science occupations:
Here: 8.5% Illinois: 1.0%
- Percentage of females in community and social services occupations:
Here: 4.4% Illinois: 2.5%
- Percentage of females in education, training, and library occupations:
Here: 5.2% Illinois: 9.6%
- Percentage of females in arts, design, entertainment, sports, and media occupations:
Here: 3.7% Illinois: 2.1%
- Percentage of females in healthcare practitioners and technical occupations:
Here: 25.1% Illinois: 10.0%
- Percentage of females in service occupations:
Here: 24.6% Illinois: 19.5%
- Percentage of females in sales and office occupations:
Here: 23.5% Illinois: 26.6%
- Percentage of females in production occupations:
Here: 4.2% Illinois: 3.6%
Education in this neighborhood (subdivision or community):
- Percentage of people 3 years and older in K-12 schools:
Lower Corridor: 32.1% Illinois: 16.6%
- Percentage of people 3 years and older in undergraduate colleges:
Lower Corridor: 13.0% Illinois: 4.8%
- Percentage of people 3 years and older in grad. or professional schools:
Lower Corridor: 4.4% Illinois: 1.6%
- Percentage of students K-12 enrolled in private schools:
Lower Corridor: 11.5% Illinois: 12.3%
Percentage of population below poverty level:
| Lower Corridor: | 4.8% |
| Illinois: | 11.9% |
Median year owner moved in (as recorded in 2022):
| Lower Corridor: | 2006 |
| Illinois: | 2010 |
Percentage of married-couple families with both working:
| Lower Corridor: | 124.7% |
| Illinois: | 73.4% |

- 82.1%Utility gas
- 12.2%Electricity
- 2.2%No fuel used
- 1.9%Wood
- 1.6%Bottled, tank, or LP gas
Highways in this neighborhood:
Riverside Ave (State Rte 25)
Length: 0.49 miles
Direction: SE-NW
Address range: 690 to 1625
Direction: SE-NW
Address range: 690 to 1625
Geneva Rd (State Rte 31)
Length: 0.45 miles
Direction: SE-NW
Address range: 600 to 1036
Direction: SE-NW
Address range: 600 to 1036
State Rte 25 (S 5th Ave)
Length: 0.12 miles
Direction: N-S
Address range: 721 to 822
Direction: N-S
Address range: 721 to 822
Roads and streets:
Prairie St
Length: 0.36 miles
Direction: E-W
Address range: 1 to 199
Direction: E-W
Address range: 1 to 199
S 6th Ave
Length: 0.21 miles
Directions: N-S, SW-NE
Address range: 700 to 1020
Directions: N-S, SW-NE
Address range: 700 to 1020
Adams Ave
Length: 0.15 miles
Directions: E-W, SW-NE
Address range: 1 to 599
Directions: E-W, SW-NE
Address range: 1 to 599
Devereaux Way
Length: 0.15 miles
Direction: E-W
Direction: E-W
S 7th Ave
Length: 0.09 miles
Direction: SE-NW
Address range: 1200 to 1402
Direction: SE-NW
Address range: 1200 to 1402
S 1st St
Length: 0.05 miles
Direction: N-S
Address range: 500 to 699
Direction: N-S
Address range: 500 to 699
S 4th Ave
Length: 0.02 miles
Direction: N-S
Address range: 700 to 799
Direction: N-S
Address range: 700 to 799