Lost Valley (Southwest Orinda) neighborhood in Orinda, California (CA), 94563 detailed profile
Settings
X


Business Search - 14 Million verified businesses
Area: 1.453 square miles
Population: 565
Population density:
| Lost Valley (Southwest Orinda): | 389 people per square mile |
| Orinda: | 1,547 people per square mile |

- 38665.8%White
- 10718.2%Asian
- 376.3%Two or more races
- 345.8%Hispanic or Latino
- 193.2%Black
- 30.5%Some other race
- 10.2%Native Hawaiian and Other
Pacific Islander

Median household income in 2022:
| Lost Valley (Southwest Orinda): | $239,721 |
| Orinda: | $250,001 |
Distribution of median household income
![Distribution of median household income]()
- 5Less than $10,000
- 62$10,000 to $19,999
- 7$20,000 to $29,999
- 12$30,000 to $39,999
- 35$40,000 to $49,999
- 13$50,000 to $59,999
- 26$60,000 to $74,999
- 4$75,000 to $99,999
- 15$100,000 to $124,999
- 13$125,000 to $149,999
- 15$150,000 to $199,999
- 120$200,000 or more

Distribution of owner-occupied house/condo value
![Distribution of owner-occupied house/condo value]()
- 8Less than $50,000
- 35$50,000 to $99,999
- 11$100,000 to $149,999
- 24$150,000 to $199,999
- 5$250,000 to $299,999
- 5$300,000 to $399,999
- 10$400,000 to $499,999
- 6$500,000 to $749,999
- 3$750,000 to $999,999
- 169$1,000,000 or more

Distribution of rent paid by renters
![Distribution of rent paid by renters]()
- 4$800 to $899
- 4$900 to $999
- 1$1,250 to $1,499
- 4$1,500 to $1,999
- 13$2,000 or more

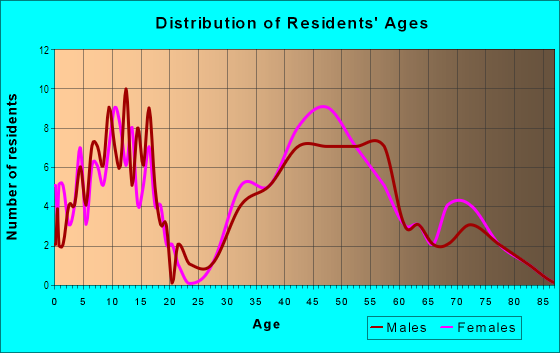
| Males: | 294 |
| Females: | 271 |
Males:
| This neighborhood: | 47.4 years |
| Whole city: | 50.3 years |
| This neighborhood: | 43.8 years |
| Whole city: | 48.0 years |
Average household size:
| Lost Valley (Southwest Orinda): | 2.8 people |
| Orinda: | 2.6 people |
Percentage of family households:
| Lost Valley (Southwest Orinda): | 53.7% |
| Orinda: | 48.6% |
| Here: | 75.3% |
| Orinda: | 67.8% |
Percentage of married-couple families with children (among all households):
| Lost Valley (Southwest Orinda): | 35.2% |
| Orinda: | 36.7% |
Percentage of single-mother households (among all households):
| Lost Valley (Southwest Orinda): | 8.9% |
| Orinda: | 0.7% |
Percentage of never married males 15 years old and over:
Percentage of never married females 15 years old and over:
| Lost Valley (Southwest Orinda): | 11.1% |
| Orinda: | 11.4% |
Percentage of never married females 15 years old and over:
| Lost Valley (Southwest Orinda): | 6.8% |
| city: | 10.3% |
Percentage of people that speak English not well or not at all:
| Lost Valley (Southwest Orinda): | 0.4% |
| Orinda: | 0.9% |
Percentage of people born in this state:
Percentage of people born in another U.S. state:
Percentage of native residents but born outside the U.S.:
Percentage of foreign born residents:
| Here: | 49.6% |
| Orinda: | 51.1% |
Percentage of people born in another U.S. state:
| Lost Valley (Southwest Orinda): | 25.6% |
| Orinda: | 29.1% |
Percentage of native residents but born outside the U.S.:
| Here: | 2.7% |
| city: | 1.5% |
Percentage of foreign born residents:
| Here: | 22.1% |
| Orinda: | 18.3% |

Owner-occupied
Renter-occupied


- Rooms in owner-occupied houses and condos in Lost Valley <
> - 41 room
- 32 rooms
- 33 rooms
- 74 rooms
- 245 rooms
- 436 rooms
- 297 rooms
- 158 rooms
- 609+ rooms

- Rooms in renter-occupied apartments in Lost Valley <
> - 61 room
- 32 rooms
- 33 rooms
- 54 rooms
- 385 rooms
- 426 rooms
- 107 rooms
- 08 rooms
- 59+ rooms
Owner-occupied
Renter-occupied

- Bedrooms in owner-occupied houses and condos in Lost Valley <
> - 4no bedroom
- 101 bedroom
- 132 bedrooms
- 563 bedrooms
- 844 bedrooms
- 225+ bedrooms

- Bedrooms in renter-occupied apartments in Lost Valley <
> - 6no bedroom
- 31 bedroom
- 32 bedrooms
- 33 bedrooms
- 104 bedrooms
- 15+ bedrooms
Average number of cars or other vehicles available in houses/condos:
Average number of cars or other vehicles available in apartments:
| This neighborhood: | 1.8 |
| Orinda: | 2.3 |
Average number of cars or other vehicles available in apartments:
| Here: | 1.6 |
| city: | 1.0 |
Percentage of units with a mortgage:
| Lost Valley (Southwest Orinda): | 70.1% |
| Orinda: | 70.5% |
Average estimated value of detached houses in 2022 (89.0% of all units):
| Lost Valley (Southwest Orinda): | $1,717,293 |
| California: | $988,808 |

- Year house built in Lost Valley <
> - 62020 or later
- 412010 to 2019
- 112000 to 2009
- 71990 to 1999
- 31980 to 1989
- 191970 to 1979
- 401960 to 1969
- 551950 to 1959
- 371940 to 1949
- 71939 or earlier

City-data.com crime index for city in 2020 (higher means more crime):
| City: | 42.7 |
| U.S. average: | 219.5 |
Travel time to work (commute)
![Travel time to work (commute)]()
- 1Less than 5 minutes
- 185 to 9 minutes
- 1110 to 14 minutes
- 4515 to 19 minutes
- 4920 to 24 minutes
- 1325 to 29 minutes
- 7630 to 34 minutes
- 835 to 39 minutes
- 1840 to 44 minutes
- 2945 to 59 minutes
- 7360 to 89 minutes
- 790 or more minutes

Means of transportation to work
![Means of transportation to work]()
- 53.7%145Drove a car alone
- 77.4%209Carpooled
- 1.5%4Bus
- 16.3%44Subway or elevated rail
- 1.9%5Long-distance train or commuter rail
- 13.3%36Light rail, streetcar or trolley
- 18.2%49Ferryboat
- 1.1%3Taxi
- 7.0%19Motorcycle
- 2.2%6Bicycle
- 5.9%16Walked
- 1.1%3Other means
- 20.7%56Worked at home

Time leaving home to go to work
![Time leaving home to go to work]()
- 512:00 a.m. to 4:59 a.m.
- 175:00 a.m. to 5:29 a.m.
- 95:30 a.m. to 5:59 a.m.
- 276:00 a.m. to 6:29 a.m.
- 296:30 a.m. to 6:59 a.m.
- 707:00 a.m. to 7:29 a.m.
- 557:30 a.m. to 7:59 a.m.
- 568:00 a.m. to 8:29 a.m.
- 368:30 a.m. to 8:59 a.m.
- 369:00 a.m. to 9:59 a.m.
- 2510:00 a.m. to 10:59 a.m.
- 411:00 a.m. to 11:59 a.m.
- 712:00 p.m. to 3:59 p.m.
- 14:00 p.m. to 11:59 p.m.

Occupations of males:
- Percentage of males in management occupations (except farmers):
Here: 26.6% city: 34.1%
- Percentage of males in business and financial operations occupations:
Here: 14.0% city: 10.7%
- Percentage of males in computer and mathematical occupations:
Here: 1.3% city: 4.2%
- Percentage of males in architecture and engineering occupations:
Here: 1.8% city: 4.1%
- Percentage of males in life, physical, and social science occupations:
Here: 3.0% city: 4.8%
- Percentage of males in legal occupations:
Here: 8.9% city: 6.7%
- Percentage of males in education, training, and library occupations:
Here: 5.2% city: 2.6%
- Percentage of males in arts, design, entertainment, sports, and media occupations:
Here: 3.9% city: 4.0%
- Percentage of males in healthcare practitioners and technical occupations:
Here: 5.2% city: 4.3%
- Percentage of males in service occupations:
Here: 4.3% city: 6.0%
- Percentage of males in sales and office occupations:
Here: 18.1% city: 11.4%
- Percentage of males in farming, fishing, and forestry occupations:
Here: 1.7% city: 0.2%
- Percentage of males in construction, extraction, and maintenance occupations:
Here: 2.2% city: 0.9%
- Percentage of males in transportation occupations:
Here: 2.2% city: 3.4%
Occupations of females:
- Percentage of females in management occupations (except farmers):
Here: 18.2% city: 15.1%
- Percentage of females in business and financial operations occupations:
Here: 15.7% city: 10.2%
- Percentage of females in architecture and engineering occupations:
Here: 2.7% city: 1.7%
- Percentage of females in life, physical, and social science occupations:
Here: 2.2% city: 5.4%
- Percentage of females in community and social services occupations:
Here: 5.2% city: 4.3%
- Percentage of females in legal occupations:
Here: 5.4% city: 7.8%
- Percentage of females in education, training, and library occupations:
Here: 5.8% city: 13.6%
- Percentage of females in arts, design, entertainment, sports, and media occupations:
Here: 7.5% city: 8.8%
- Percentage of females in healthcare practitioners and technical occupations:
Here: 19.5% city: 11.5%
- Percentage of females in service occupations:
Here: 9.9% city: 7.1%
- Percentage of females in sales and office occupations:
Here: 9.4% city: 8.1%
Education in this neighborhood (subdivision or community):
- Percentage of people 3 years and older in K-12 schools:
Lost Valley (Southwest Orinda): 15.8% Orinda: 20.8%
- Percentage of people 3 years and older in undergraduate colleges:
Lost Valley (Southwest Orinda): 45.5% Orinda: 3.5%
- Percentage of people 3 years and older in grad. or professional schools:
Lost Valley (Southwest Orinda): 9.6% Orinda: 1.3%
- Percentage of students K-12 enrolled in private schools:
Lost Valley (Southwest Orinda): 46.4% Orinda: 7.3%
Percentage of population below poverty level:
| Lost Valley (Southwest Orinda): | 0.9% |
| Orinda: | 2.1% |
Median year owner moved in (as recorded in 2022):
| Lost Valley (Southwest Orinda): | 2004 |
| Orinda: | 2005 |
Percentage of married-couple families with both working:
| Lost Valley (Southwest Orinda): | 75.5% |
| Orinda: | 71.9% |

- 72.2%Utility gas
- 16.3%Electricity
- 3.8%Bottled, tank, or LP gas
- 3.3%Other fuel
- 1.7%Solar energy
- 1.7%No fuel used
- 1.0%Wood
Roads and streets:
Crestview Dr
Length: 1.49 miles
Directions: E-W, N-S, SE-NW, SW-NE
Address range: 1 to 299
Directions: E-W, N-S, SE-NW, SW-NE
Address range: 1 to 299
Moraga Way
Length: 1.01 miles
Directions: E-W, SE-NW
Address range: 202 to 450
Directions: E-W, SE-NW
Address range: 202 to 450
Lost Valley Dr
Length: 0.99 miles
Directions: E-W, N-S, SE-NW, SW-NE
Address range: 1 to 99
Directions: E-W, N-S, SE-NW, SW-NE
Address range: 1 to 99
Valley View Dr
Length: 0.57 miles
Directions: N-S, SW-NE
Address range: 1 to 199
Directions: N-S, SW-NE
Address range: 1 to 199
Oak Dr
Length: 0.50 miles
Directions: E-W, N-S, SE-NW, SW-NE
Address range: 1 to 99
Directions: E-W, N-S, SE-NW, SW-NE
Address range: 1 to 99
Monte Veda Rd
Length: 0.32 miles
Directions: SE-NW, SW-NE
Address range: 1 to 99
Directions: SE-NW, SW-NE
Address range: 1 to 99
Buena Vis
Length: 0.22 miles
Directions: E-W, N-S, SE-NW, SW-NE
Address range: 1 to 99
Directions: E-W, N-S, SE-NW, SW-NE
Address range: 1 to 99
Hilldale Ct
Length: 0.21 miles
Directions: N-S, SE-NW, SW-NE
Address range: 1 to 199
Directions: N-S, SE-NW, SW-NE
Address range: 1 to 199
Sanborn Rd
Length: 0.18 miles
Directions: SE-NW, SW-NE
Address range: 1 to 99
Directions: SE-NW, SW-NE
Address range: 1 to 99
Crestview Ct
Length: 0.17 miles
Directions: E-W, N-S, SE-NW
Address range: 1 to 99
Directions: E-W, N-S, SE-NW
Address range: 1 to 99
Casa Vieja
Length: 0.17 miles
Directions: E-W, N-S, SE-NW, SW-NE
Address range: 1 to 99
Directions: E-W, N-S, SE-NW, SW-NE
Address range: 1 to 99
la Fond Ln
Length: 0.16 miles
Directions: E-W, SW-NE
Address range: 1 to 99
Directions: E-W, SW-NE
Address range: 1 to 99
Culver Ct
Length: 0.16 miles
Directions: E-W, SW-NE
Address range: 1 to 99
Directions: E-W, SW-NE
Address range: 1 to 99
Fern Way
Length: 0.14 miles
Directions: SE-NW, SW-NE
Address range: 1 to 99
Directions: SE-NW, SW-NE
Address range: 1 to 99
Edgewood Ct (Edgewood Rd)
Length: 0.14 miles
Directions: E-W, SW-NE
Address range: 1 to 19
Directions: E-W, SW-NE
Address range: 1 to 19
Crest View Ter
Length: 0.14 miles
Directions: E-W, N-S, SE-NW, SW-NE
Address range: 1 to 26
Directions: E-W, N-S, SE-NW, SW-NE
Address range: 1 to 26
Lost Valley Ct
Length: 0.13 miles
Directions: E-W, N-S, SE-NW, SW-NE
Address range: 1 to 99
Directions: E-W, N-S, SE-NW, SW-NE
Address range: 1 to 99
Snow Ct
Length: 0.12 miles
Direction: SW-NE
Address range: 1 to 99
Direction: SW-NE
Address range: 1 to 99
Los Cerros
Length: 0.11 miles
Directions: SE-NW, SW-NE
Address range: 1 to 99
Directions: SE-NW, SW-NE
Address range: 1 to 99
Kenmore Ct
Length: 0.09 miles
Directions: N-S, SE-NW
Address range: 1 to 99
Directions: N-S, SE-NW
Address range: 1 to 99
Albo Ct
Length: 0.09 miles
Directions: E-W, SW-NE
Address range: 1 to 99
Directions: E-W, SW-NE
Address range: 1 to 99
Roselle Ln
Length: 0.09 miles
Directions: E-W, SE-NW
Address range: 1 to 99
Directions: E-W, SE-NW
Address range: 1 to 99
Jewel Ct
Length: 0.08 miles
Direction: E-W
Address range: 1 to 99
Direction: E-W
Address range: 1 to 99
Don Gabriel Way
Length: 0.08 miles
Direction: SE-NW
Direction: SE-NW
Poco Paseo
Length: 0.07 miles
Direction: E-W
Address range: 1 to 99
Direction: E-W
Address range: 1 to 99
Casa Vieja Pl
Length: 0.07 miles
Direction: SE-NW
Address range: 100 to 199
Direction: SE-NW
Address range: 100 to 199
Richard Ct
Length: 0.06 miles
Directions: E-W, SE-NW
Address range: 1 to 99
Directions: E-W, SE-NW
Address range: 1 to 99
Crestview Ter
Length: 0.05 miles
Directions: E-W, SE-NW, SW-NE
Directions: E-W, SE-NW, SW-NE
Wilber Cir
Length: 0.04 miles
Direction: E-W
Address range: 1 to 49
Direction: E-W
Address range: 1 to 49
Vis del Moraga
Length: 0.04 miles
Direction: SW-NE
Address range: 5 to 99
Direction: SW-NE
Address range: 5 to 99
Orchard Ct
Length: 0.04 miles
Direction: SW-NE
Address range: 1 to 99
Direction: SW-NE
Address range: 1 to 99
Brookside Rd
Length: 0.03 miles
Direction: SW-NE
Address range: 66 to 99
Direction: SW-NE
Address range: 66 to 99
Other features:
Moraga Crk
Length: 0.76 miles
Directions: E-W, SE-NW
Directions: E-W, SE-NW
West Branch Crk
Length: 0.02 miles
Direction: SW-NE
Direction: SW-NE