Longwood neighborhood in Brookline, Massachusetts (MA), 02446 detailed profile
Settings
X

Business Search - 14 Million verified businesses
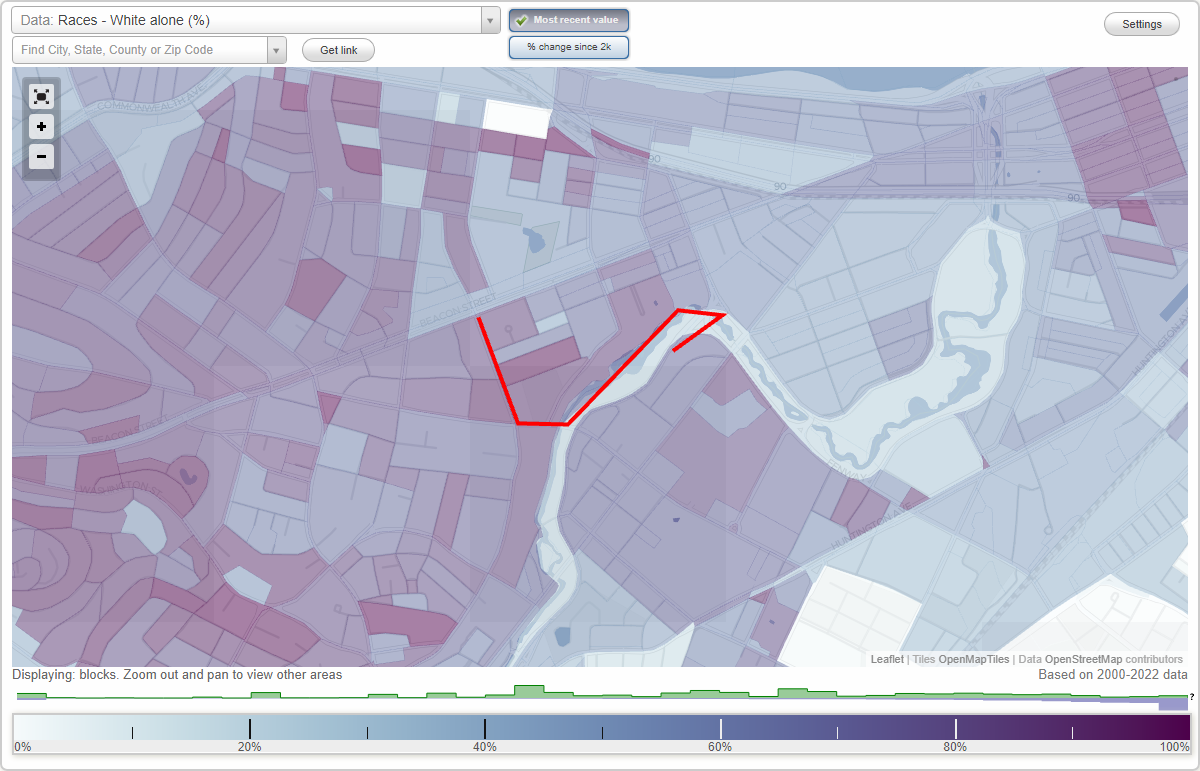
Area: 0.095 square miles
Population: 1,361
Population density:
| Longwood: | 14,380 people per square mile |
| Brookline: | 9,233 people per square mile |

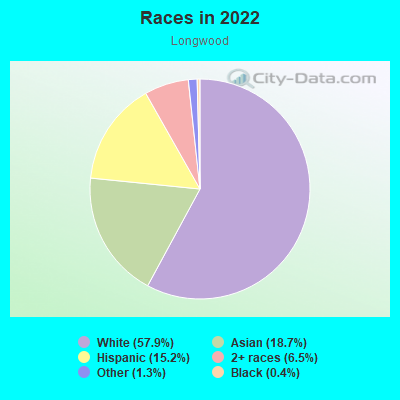
- 82357.9%White
- 26618.7%Asian
- 21615.2%Hispanic or Latino
- 926.5%Two or more races
- 181.3%Some other race
- 60.4%Black
Median household income in 2022:
| Longwood: | $102,315 |
| Brookline: | $130,600 |
Distribution of median household income
![Distribution of median household income]()
- 65Less than $10,000
- 49$10,000 to $19,999
- 11$20,000 to $29,999
- 96$30,000 to $39,999
- 97$40,000 to $49,999
- 4$50,000 to $59,999
- 25$60,000 to $74,999
- 39$75,000 to $99,999
- 241$100,000 to $124,999
- 22$125,000 to $149,999
- 138$150,000 to $199,999
- 85$200,000 or more

Distribution of owner-occupied house/condo value
![Distribution of owner-occupied house/condo value]()
- 6$300,000 to $399,999
- 7$400,000 to $499,999
- 29$500,000 to $749,999
- 61$750,000 to $999,999
- 95$1,000,000 or more

Distribution of rent paid by renters
![Distribution of rent paid by renters]()
- 29Less than $100
- 24$200 to $299
- 13$300 to $399
- 18$500 to $599
- 84$700 to $799
- 52$800 to $899
- 61$1,000 to $1,249
- 19$1,250 to $1,499
- 84$1,500 to $1,999
- 455$2,000 or more

Median rent in 2022:
| Longwood: | $2,794 |
| Brookline: | $2,001 |
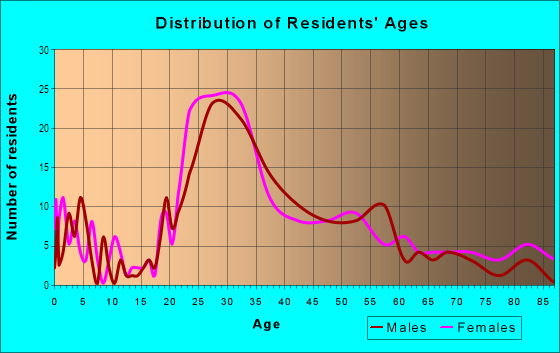
| Males: | 597 |
| Females: | 763 |
Males:
| This neighborhood: | 24.5 years |
| Whole city: | 34.4 years |
| This neighborhood: | 24.0 years |
| Whole city: | 35.8 years |
Average household size:
| Longwood: | 1.9 people |
| Brookline: | 2.3 people |
Percentage of family households:
| Longwood: | 14.3% |
| Brookline: | 36.3% |
| Here: | 21.9% |
| Brookline: | 41.2% |
Percentage of married-couple families with children (among all households):
| Longwood: | 53.7% |
| Brookline: | 37.7% |
Percentage of single-mother households (among all households):
| Longwood: | 8.7% |
| Brookline: | 4.2% |
Percentage of never married males 15 years old and over:
Percentage of never married females 15 years old and over:
| Longwood: | 27.1% |
| Brookline: | 19.2% |
Percentage of never married females 15 years old and over:
| Longwood: | 29.6% |
| place: | 24.8% |
Percentage of people that speak English not well or not at all:
| Longwood: | 4.9% |
| Brookline: | 2.6% |
Percentage of people born in this state:
Percentage of people born in another U.S. state:
Percentage of native residents but born outside the U.S.:
Percentage of foreign born residents:
| Here: | 24.1% |
| Brookline: | 31.2% |
Percentage of people born in another U.S. state:
| Longwood: | 39.0% |
| Brookline: | 37.7% |
Percentage of native residents but born outside the U.S.:
| Here: | 1.6% |
| place: | 1.9% |
Percentage of foreign born residents:
| Here: | 35.3% |
| Brookline: | 29.3% |
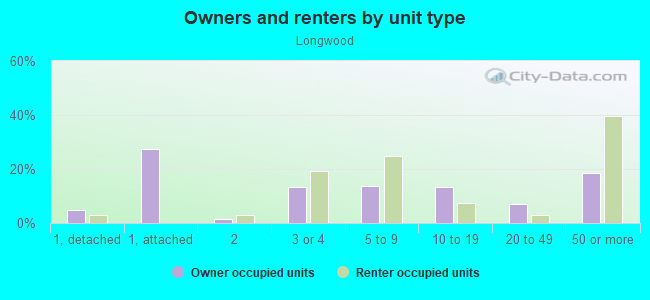
Owner-occupied
Renter-occupied

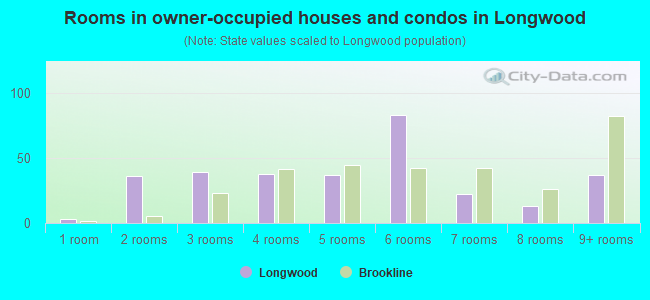
- Rooms in owner-occupied houses and condos in Longwood
- 31 room
- 362 rooms
- 393 rooms
- 384 rooms
- 375 rooms
- 836 rooms
- 227 rooms
- 138 rooms
- 379+ rooms
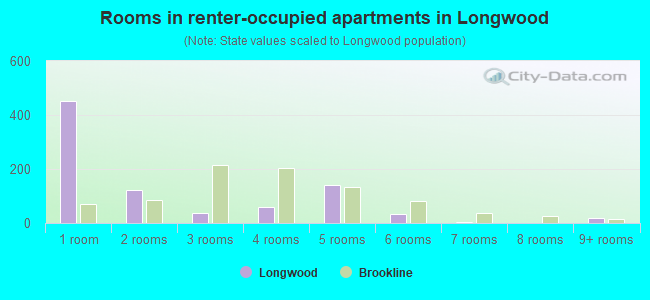
- Rooms in renter-occupied apartments in Longwood
- 4511 room
- 1222 rooms
- 373 rooms
- 604 rooms
- 1415 rooms
- 356 rooms
- 37 rooms
- 08 rooms
- 179+ rooms
Owner-occupied
Renter-occupied
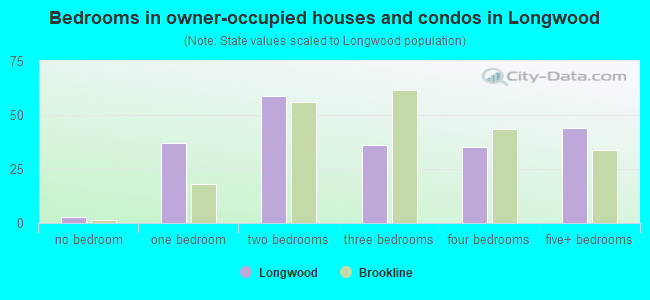
- Bedrooms in owner-occupied houses and condos in Longwood
- 3no bedroom
- 371 bedroom
- 592 bedrooms
- 363 bedrooms
- 354 bedrooms
- 445+ bedrooms
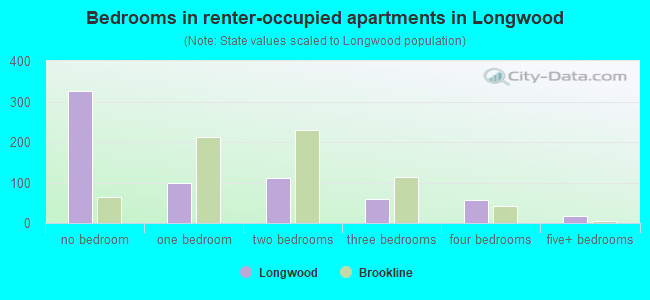
- Bedrooms in renter-occupied apartments in Longwood
- 325no bedroom
- 981 bedroom
- 1122 bedrooms
- 593 bedrooms
- 574 bedrooms
- 175+ bedrooms
Average number of cars or other vehicles available in houses/condos:
Average number of cars or other vehicles available in apartments:
| This neighborhood: | 1.2 |
| Brookline: | 1.4 |
Average number of cars or other vehicles available in apartments:
| Here: | 0.6 |
| place: | 0.7 |
Percentage of units with a mortgage:
| Longwood: | 57.7% |
| Brookline: | 57.9% |
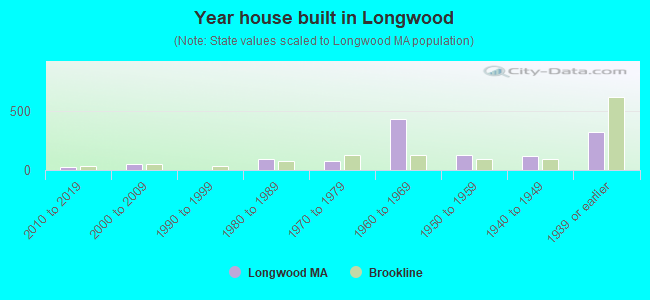
- Year house built in Longwood
- 02020 or later
- 282010 to 2019
- 472000 to 2009
- 11990 to 1999
- 931980 to 1989
- 771970 to 1979
- 4331960 to 1969
- 1261950 to 1959
- 1161940 to 1949
- 3241939 or earlier
City-data.com crime index for place in 2020 (higher means more crime):
| City: | 76.3 |
| U.S. average: | 219.5 |
Travel time to work (commute)
![Travel time to work (commute)]()
- 25Less than 5 minutes
- 705 to 9 minutes
- 13210 to 14 minutes
- 18315 to 19 minutes
- 12820 to 24 minutes
- 6925 to 29 minutes
- 14330 to 34 minutes
- 735 to 39 minutes
- 3740 to 44 minutes
- 2645 to 59 minutes
- 2860 to 89 minutes
- 2690 or more minutes

Means of transportation to work
![Means of transportation to work]()
- 12.7%108Drove a car alone
- 8.9%76Carpooled
- 19.5%166Bus
- 11.4%97Subway or elevated rail
- 2.2%19Long-distance train or commuter rail
- 16.3%139Light rail, streetcar or trolley
- 1.6%14Bicycle
- 23.8%203Walked
- 4.1%35Other means
- 22.7%193Worked at home

Time leaving home to go to work
![Time leaving home to go to work]()
- 812:00 a.m. to 4:59 a.m.
- 115:00 a.m. to 5:29 a.m.
- 285:30 a.m. to 5:59 a.m.
- 276:00 a.m. to 6:29 a.m.
- 606:30 a.m. to 6:59 a.m.
- 947:00 a.m. to 7:29 a.m.
- 1207:30 a.m. to 7:59 a.m.
- 2478:00 a.m. to 8:29 a.m.
- 738:30 a.m. to 8:59 a.m.
- 949:00 a.m. to 9:59 a.m.
- 1110:00 a.m. to 10:59 a.m.
- 1411:00 a.m. to 11:59 a.m.
- 7412:00 p.m. to 3:59 p.m.
- 614:00 p.m. to 11:59 p.m.

Occupations of males:
- Percentage of males in management occupations (except farmers):
Here: 4.8% place: 16.2%
- Percentage of males in computer and mathematical occupations:
Here: 22.2% place: 13.6%
- Percentage of males in architecture and engineering occupations:
Here: 19.2% place: 5.2%
- Percentage of males in life, physical, and social science occupations:
Here: 3.7% place: 8.6%
- Percentage of males in legal occupations:
Here: 2.1% place: 3.9%
- Percentage of males in education, training, and library occupations:
Here: 8.1% place: 12.1%
- Percentage of males in healthcare practitioners and technical occupations:
Here: 20.1% place: 12.7%
- Percentage of males in service occupations:
Here: 3.5% place: 3.1%
- Percentage of males in sales and office occupations:
Here: 16.2% place: 8.2%
Occupations of females:
- Percentage of females in management occupations (except farmers):
Here: 33.8% place: 12.0%
- Percentage of females in business and financial operations occupations:
Here: 4.4% place: 8.2%
- Percentage of females in computer and mathematical occupations:
Here: 6.4% place: 5.0%
- Percentage of females in architecture and engineering occupations:
Here: 1.5% place: 1.2%
- Percentage of females in life, physical, and social science occupations:
Here: 4.8% place: 10.5%
- Percentage of females in community and social services occupations:
Here: 2.1% place: 3.1%
- Percentage of females in education, training, and library occupations:
Here: 14.0% place: 14.8%
- Percentage of females in arts, design, entertainment, sports, and media occupations:
Here: 7.5% place: 3.6%
- Percentage of females in healthcare practitioners and technical occupations:
Here: 13.7% place: 16.5%
- Percentage of females in service occupations:
Here: 1.6% place: 9.2%
- Percentage of females in sales and office occupations:
Here: 7.0% place: 11.7%
- Percentage of females in production occupations:
Here: 3.2% place: 0.5%
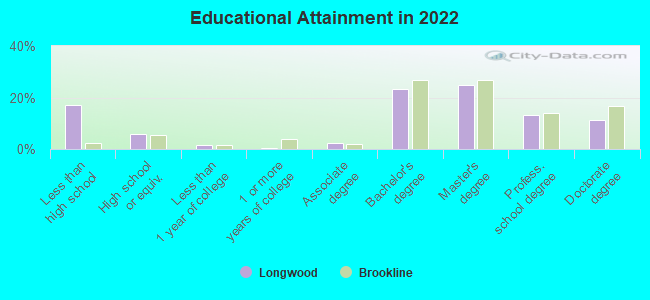
Education in this neighborhood (subdivision or community):
- Percentage of people 3 years and older in K-12 schools:
Longwood: 12.1% Brookline: 13.4%
- Percentage of people 3 years and older in undergraduate colleges:
Longwood: 9.6% Brookline: 5.8%
- Percentage of people 3 years and older in grad. or professional schools:
Longwood: 7.4% Brookline: 5.2%
- Percentage of students K-12 enrolled in private schools:
Longwood: 60.8% Brookline: 17.6%
Percentage of population below poverty level:
| Longwood: | 19.7% |
| Brookline: | 10.1% |
Median year owner moved in (as recorded in 2022):
Median year renter moved in (as recorded in 2022):
| Longwood: | 2010 |
| Brookline: | 2007 |
Median year renter moved in (as recorded in 2022):
| Longwood: | 2019 |
| Brookline: | 2018 |
Percentage of married-couple families with both working:
| Longwood: | 75.1% |
| Brookline: | 78.7% |
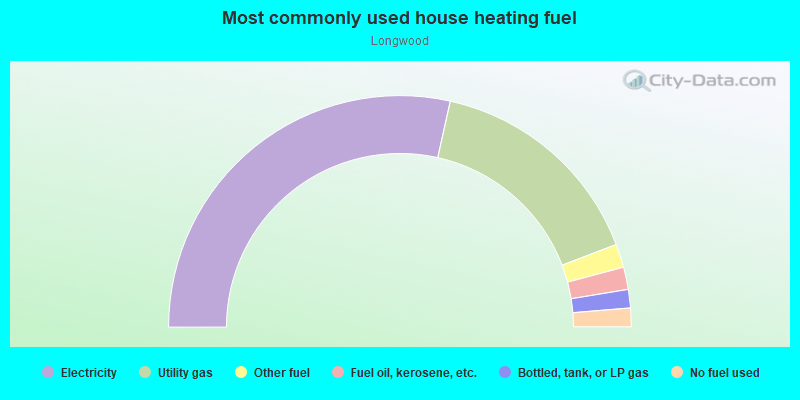
- 57.0%Electricity
- 31.4%Utility gas
- 3.3%Other fuel
- 3.1%Fuel oil, kerosene, etc.
- 2.6%Bottled, tank, or LP gas
- 2.6%No fuel used
Roads and streets:
Monmouth St
Length: 0.30 miles
Direction: E-W
Address range: 1 to 199
Direction: E-W
Address range: 1 to 199
Chapel St
Length: 0.23 miles
Direction: SW-NE
Address range: 2 to 98
Direction: SW-NE
Address range: 2 to 98
Hawes St
Length: 0.21 miles
Directions: E-W, SE-NW, SW-NE
Address range: 1 to 48
Directions: E-W, SE-NW, SW-NE
Address range: 1 to 48
Chatham St
Length: 0.17 miles
Directions: E-W, SW-NE
Address range: 17 to 62
Directions: E-W, SW-NE
Address range: 17 to 62
Carlton St
Length: 0.12 miles
Directions: N-S, SE-NW
Address range: 1 to 38
Directions: N-S, SE-NW
Address range: 1 to 38
St Marys St (Saint Marys St)
Length: 0.11 miles
Direction: SE-NW
Address range: 102 to 199
Direction: SE-NW
Address range: 102 to 199
Hawes Pl
Length: 0.09 miles
Direction: E-W
Direction: E-W
Colchester St
Length: 0.07 miles
Directions: N-S, SW-NE
Address range: 1 to 51
Directions: N-S, SW-NE
Address range: 1 to 51
Borland St
Length: 0.03 miles
Direction: SE-NW
Address range: 28 to 99
Direction: SE-NW
Address range: 28 to 99
Chatham Cir
Length: 0.02 miles
Directions: N-S, SE-NW
Address range: 1 to 20
Directions: N-S, SE-NW
Address range: 1 to 20
Mass transit rail lines:
Mbta Green Line Trolley
Length: 0.46 miles
Directions: E-W, SW-NE
Directions: E-W, SW-NE
Roads and streets:
Saint Marys St (St Marys St)
Length: 0.11 miles
Direction: SE-NW
Address range: 102 to 199
Direction: SE-NW
Address range: 102 to 199