Linwood Park neighborhood in Vermilion, Ohio (OH), 44089 detailed profile
Settings
X


Business Search - 14 Million verified businesses
Area: 0.167 square miles
Population: 481
Population density:
| Linwood Park: | 2,873 people per square mile |
| Vermilion: | 969 people per square mile |

- 46995.1%White
- 122.4%Two or more races
- 112.2%Hispanic or Latino
- 10.2%Asian

Median household income in 2022:
| Linwood Park: | $91,311 |
| Vermilion: | $73,458 |
Distribution of median household income
![Distribution of median household income]()
- 12Less than $10,000
- 15$10,000 to $19,999
- 42$20,000 to $29,999
- 24$30,000 to $39,999
- 10$40,000 to $49,999
- 22$50,000 to $59,999
- 23$60,000 to $74,999
- 15$75,000 to $99,999
- 23$100,000 to $124,999
- 4$125,000 to $149,999
- 69$150,000 to $199,999
- 24$200,000 or more

Distribution of owner-occupied house/condo value
![Distribution of owner-occupied house/condo value]()
- 11Less than $50,000
- 9$50,000 to $99,999
- 55$100,000 to $149,999
- 38$150,000 to $199,999
- 28$200,000 to $249,999
- 6$250,000 to $299,999
- 19$300,000 to $399,999
- 14$400,000 to $499,999
- 13$500,000 to $749,999
- 13$750,000 to $999,999
- 8$1,000,000 or more

Distribution of rent paid by renters
![Distribution of rent paid by renters]()
- 2$500 to $599
- 9$600 to $699
- 31$700 to $799
- 7$800 to $899
- 50$900 to $999
- 46$1,000 to $1,249
- 13$1,250 to $1,499
- 31$1,500 to $1,999
- 3$2,000 or more

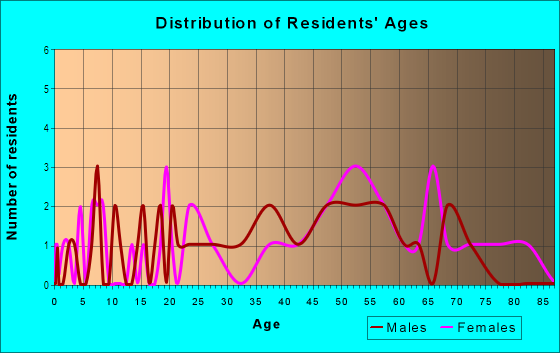
| Males: | 249 |
| Females: | 231 |
Males:
| This neighborhood: | 50.8 years |
| Whole city: | 45.9 years |
| This neighborhood: | 53.7 years |
| Whole city: | 49.8 years |
Average household size:
| Linwood Park: | 9.1 people |
| Vermilion: | 2.3 people |
Percentage of family households:
| Linwood Park: | 47.1% |
| Vermilion: | 40.3% |
| Here: | 60.2% |
| Vermilion: | 49.9% |
Percentage of married-couple families with children (among all households):
| Linwood Park: | 32.0% |
| Vermilion: | 33.7% |
Percentage of single-mother households (among all households):
| Linwood Park: | 6.5% |
| Vermilion: | 7.8% |
Percentage of never married males 15 years old and over:
Percentage of never married females 15 years old and over:
| Linwood Park: | 16.9% |
| Vermilion: | 14.4% |
Percentage of never married females 15 years old and over:
| Linwood Park: | 13.5% |
| city: | 12.4% |
Percentage of people that speak English not well or not at all:
| Linwood Park: | 0.0% |
| Vermilion: | 0.0% |
Percentage of people born in this state:
Percentage of people born in another U.S. state:
Percentage of native residents but born outside the U.S.:
Percentage of foreign born residents:
| Here: | 83.6% |
| Vermilion: | 80.7% |
Percentage of people born in another U.S. state:
| Linwood Park: | 14.5% |
| Vermilion: | 17.9% |
Percentage of native residents but born outside the U.S.:
| Here: | 1.1% |
| city: | 0.6% |
Percentage of foreign born residents:
| Here: | 0.8% |
| Vermilion: | 0.8% |

Owner-occupied
Renter-occupied


- Rooms in owner-occupied houses and condos in Linwood Park
- 01 room
- 02 rooms
- 03 rooms
- 484 rooms
- 55 rooms
- 226 rooms
- 217 rooms
- 228 rooms
- 289+ rooms

- Rooms in renter-occupied apartments in Linwood Park
- 21 room
- 32 rooms
- 513 rooms
- 244 rooms
- 55 rooms
- 196 rooms
- 107 rooms
- 58 rooms
- 309+ rooms
Owner-occupied
Renter-occupied

- Bedrooms in owner-occupied houses and condos in Linwood Park
- 0no bedroom
- 91 bedroom
- 662 bedrooms
- 623 bedrooms
- 374 bedrooms
- 105+ bedrooms

- Bedrooms in renter-occupied apartments in Linwood Park
- 2no bedroom
- 671 bedroom
- 252 bedrooms
- 393 bedrooms
- 04 bedrooms
- 305+ bedrooms
Average number of cars or other vehicles available in houses/condos:
Average number of cars or other vehicles available in apartments:
| This neighborhood: | 2.1 |
| Vermilion: | 2.0 |
Average number of cars or other vehicles available in apartments:
| Here: | 2.9 |
| city: | 1.8 |
Percentage of units with a mortgage:
| Linwood Park: | 50.6% |
| Vermilion: | 65.7% |
Average estimated value of detached houses in 2022 (84.9% of all units):
| Linwood Park: | $430,965 |
| Vermilion: | $214,039 |

- Year house built in Linwood Park
- 02020 or later
- 172010 to 2019
- 242000 to 2009
- 301990 to 1999
- 221980 to 1989
- 151970 to 1979
- 451960 to 1969
- 191950 to 1959
- 111940 to 1949
- 1571939 or earlier

City-data.com crime index for city in 2020 (higher means more crime):
| City: | 35.5 |
| U.S. average: | 219.5 |
Travel time to work (commute)
![Travel time to work (commute)]()
- 14Less than 5 minutes
- 205 to 9 minutes
- 2010 to 14 minutes
- 3115 to 19 minutes
- 3420 to 24 minutes
- 4825 to 29 minutes
- 4330 to 34 minutes
- 135 to 39 minutes
- 1740 to 44 minutes
- 3045 to 59 minutes
- 1460 to 89 minutes
- 1390 or more minutes

Means of transportation to work
![Means of transportation to work]()
- 77.8%175Drove a car alone
- 16.5%37Carpooled
- 4.9%11Worked at home

Time leaving home to go to work
![Time leaving home to go to work]()
- 1812:00 a.m. to 4:59 a.m.
- 25:00 a.m. to 5:29 a.m.
- 195:30 a.m. to 5:59 a.m.
- 316:00 a.m. to 6:29 a.m.
- 246:30 a.m. to 6:59 a.m.
- 407:00 a.m. to 7:29 a.m.
- 327:30 a.m. to 7:59 a.m.
- 578:00 a.m. to 8:29 a.m.
- 38:30 a.m. to 8:59 a.m.
- 149:00 a.m. to 9:59 a.m.
- 810:00 a.m. to 10:59 a.m.
- 211:00 a.m. to 11:59 a.m.
- 1512:00 p.m. to 3:59 p.m.
- 124:00 p.m. to 11:59 p.m.

Occupations of males:
- Percentage of males in management occupations (except farmers):
Here: 34.8% city: 14.1%
- Percentage of males in business and financial operations occupations:
Here: 5.6% city: 5.7%
- Percentage of males in education, training, and library occupations:
Here: 3.8% city: 1.9%
- Percentage of males in arts, design, entertainment, sports, and media occupations:
Here: 1.3% city: 0.6%
- Percentage of males in healthcare practitioners and technical occupations:
Here: 4.0% city: 3.8%
- Percentage of males in service occupations:
Here: 29.8% city: 14.1%
- Percentage of males in sales and office occupations:
Here: 11.3% city: 20.3%
- Percentage of males in construction, extraction, and maintenance occupations:
Here: 10.3% city: 7.2%
- Percentage of males in transportation occupations:
Here: 5.7% city: 4.8%
Occupations of females:
- Percentage of females in management occupations (except farmers):
Here: 40.3% city: 12.0%
- Percentage of females in community and social services occupations:
Here: 5.6% city: 0.5%
- Percentage of females in education, training, and library occupations:
Here: 30.8% city: 14.3%
- Percentage of females in sales and office occupations:
Here: 16.5% city: 28.7%
- Percentage of females in production occupations:
Here: 8.1% city: 4.2%
- Percentage of females in transportation occupations:
Here: 5.6% city: 2.7%
Education in this neighborhood (subdivision or community):
- Percentage of people 3 years and older in K-12 schools:
Linwood Park: 32.4% Vermilion: 14.7%
- Percentage of people 3 years and older in undergraduate colleges:
Linwood Park: 5.4% Vermilion: 3.3%
- Percentage of people 3 years and older in grad. or professional schools:
Linwood Park: 4.0% Vermilion: 1.0%
- Percentage of students K-12 enrolled in private schools:
Linwood Park: 8.3% Vermilion: 18.9%
Percentage of population below poverty level:
| Linwood Park: | 3.5% |
| Vermilion: | 4.6% |
Median year owner moved in (as recorded in 2022):
| Linwood Park: | 2005 |
| Vermilion: | 2005 |
Percentage of married-couple families with both working:
| Linwood Park: | 94.4% |
| Vermilion: | 82.5% |

- 66.6%Utility gas
- 28.0%Electricity
- 2.7%Bottled, tank, or LP gas
- 2.7%Wood
Highways in this neighborhood:
US Hwy 6 (Liberty Ave, US Rte 6)
Length: 0.37 miles
Directions: E-W, SW-NE
Address range: 4692 to 4943
Directions: E-W, SW-NE
Address range: 4692 to 4943
Roads and streets:
Linwood Ave
Length: 0.62 miles
Directions: E-W, N-S, SE-NW, SW-NE
Directions: E-W, N-S, SE-NW, SW-NE
1st St
Length: 0.32 miles
Direction: E-W
Direction: E-W
Ewa Yea St
Length: 0.19 miles
Directions: N-S, SE-NW
Address range: 400 to 473
Directions: N-S, SE-NW
Address range: 400 to 473
Ash St
Length: 0.19 miles
Directions: E-W, N-S, SW-NE
Address range: 400 to 499
Directions: E-W, N-S, SW-NE
Address range: 400 to 499
Shoreline Way
Length: 0.18 miles
Directions: E-W, SW-NE
Address range: 4700 to 5261
Directions: E-W, SW-NE
Address range: 4700 to 5261
Linden St
Length: 0.17 miles
Directions: N-S, SW-NE
Address range: 401 to 499
Directions: N-S, SW-NE
Address range: 401 to 499
Walnut St
Length: 0.17 miles
Direction: N-S
Address range: 400 to 499
Direction: N-S
Address range: 400 to 499
Salem Dr
Length: 0.16 miles
Direction: N-S
Address range: 300 to 499
Direction: N-S
Address range: 300 to 499
Minnie Wawa St
Length: 0.16 miles
Directions: N-S, SE-NW
Address range: 400 to 449
Directions: N-S, SE-NW
Address range: 400 to 449
6th St
Length: 0.16 miles
Direction: E-W
Address range: 5100 to 5263
Direction: E-W
Address range: 5100 to 5263
7th St
Length: 0.16 miles
Direction: E-W
Address range: 5100 to 5255
Direction: E-W
Address range: 5100 to 5255
5th St
Length: 0.16 miles
Direction: E-W
Address range: 5115 to 5161
Direction: E-W
Address range: 5115 to 5161
Shoreline Dr
Length: 0.15 miles
Directions: E-W, SW-NE
Address range: 4801 to 4981
Directions: E-W, SW-NE
Address range: 4801 to 4981
Elm St
Length: 0.11 miles
Directions: E-W, N-S
Address range: 5053 to 5113
Directions: E-W, N-S
Address range: 5053 to 5113
Peach St
Length: 0.09 miles
Directions: N-S, SW-NE
Directions: N-S, SW-NE
Nantucket Pl
Length: 0.09 miles
Directions: N-S, SE-NW
Address range: 301 to 462
Directions: N-S, SE-NW
Address range: 301 to 462
Poplar St
Length: 0.09 miles
Directions: N-S, SE-NW
Directions: N-S, SE-NW
Tabernacle St
Length: 0.09 miles
Directions: E-W, N-S
Directions: E-W, N-S
2nd St
Length: 0.08 miles
Direction: E-W
Direction: E-W
Maple St
Length: 0.08 miles
Direction: N-S
Address range: 400 to 439
Direction: N-S
Address range: 400 to 439
Cherry St
Length: 0.08 miles
Directions: N-S, SW-NE
Directions: N-S, SW-NE
Hiawatha Dr
Length: 0.06 miles
Direction: E-W
Address range: 4801 to 4846
Direction: E-W
Address range: 4801 to 4846
Wa Wa Taysee St
Length: 0.06 miles
Direction: E-W
Address range: 4800 to 4899
Direction: E-W
Address range: 4800 to 4899
Chestnut St
Length: 0.05 miles
Directions: N-S, SE-NW, SW-NE
Address range: 401 to 449
Directions: N-S, SE-NW, SW-NE
Address range: 401 to 449