Laurel Village neighborhood in San Francisco, California (CA), 94118 detailed profile
Settings
X


Business Search - 14 Million verified businesses
Area: 0.015 square miles
Population: 407
Population density:
| Laurel Village: | 26,700 people per square mile |
| San Francisco: | 17,313 people per square mile |

- 20850.9%White
- 11929.1%Asian
- 4711.5%Hispanic or Latino
- 327.8%Two or more races
- 30.7%Black

Median household income in 2022:
| Laurel Village: | $32,981 |
| San Francisco: | $136,692 |
Distribution of median household income
![Distribution of median household income]()
- 3Less than $10,000
- 84$10,000 to $19,999
- 23$20,000 to $29,999
- 16$30,000 to $39,999
- 20$40,000 to $49,999
- 11$50,000 to $59,999
- 4$60,000 to $74,999
- 2$75,000 to $99,999
- 13$100,000 to $124,999
- 6$125,000 to $149,999
- 27$150,000 to $199,999
- 36$200,000 or more

Distribution of owner-occupied house/condo value
![Distribution of owner-occupied house/condo value]()
- 3Less than $50,000
- 6$200,000 to $249,999
- 2$400,000 to $499,999
- 2$500,000 to $749,999
- 27$1,000,000 or more

Distribution of rent paid by renters
![Distribution of rent paid by renters]()
- 22$200 to $299
- 50$300 to $399
- 4$400 to $499
- 49$500 to $599
- 4$600 to $699
- 11$1,000 to $1,249
- 2$1,250 to $1,499
- 23$1,500 to $1,999
- 36$2,000 or more

Median rent in 2022:
| Laurel Village: | $532 |
| San Francisco: | $2,001 |
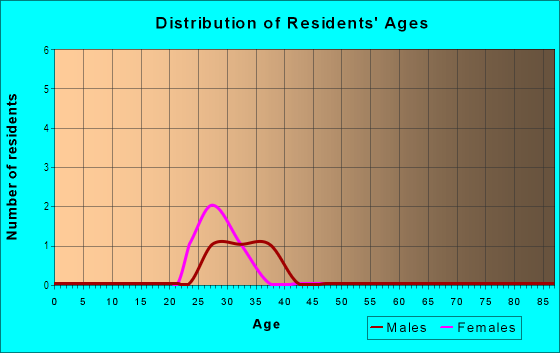
| Males: | 145 |
| Females: | 262 |
Males:
| This neighborhood: | 54.1 years |
| Whole city: | 40.3 years |
| This neighborhood: | 69.1 years |
| Whole city: | 40.5 years |
Average household size:
| Laurel Village: | 1.8 people |
| San Francisco: | 2.2 people |
Percentage of family households:
| Laurel Village: | 25.2% |
| San Francisco: | 30.3% |
| Here: | 40.5% |
| San Francisco: | 35.3% |
Percentage of married-couple families with children (among all households):
| Laurel Village: | 35.9% |
| San Francisco: | 35.9% |
Percentage of single-mother households (among all households):
| Laurel Village: | 19.1% |
| San Francisco: | 6.0% |
Percentage of never married males 15 years old and over:
Percentage of never married females 15 years old and over:
| Laurel Village: | 9.1% |
| San Francisco: | 24.6% |
Percentage of never married females 15 years old and over:
| Laurel Village: | 7.2% |
| city: | 19.9% |
Percentage of people that speak English not well or not at all:
| Laurel Village: | 25.6% |
| San Francisco: | 10.9% |
Percentage of people born in this state:
Percentage of people born in another U.S. state:
Percentage of native residents but born outside the U.S.:
Percentage of foreign born residents:
| Here: | 40.1% |
| San Francisco: | 40.8% |
Percentage of people born in another U.S. state:
| Laurel Village: | 34.1% |
| San Francisco: | 23.4% |
Percentage of native residents but born outside the U.S.:
| Here: | 2.1% |
| city: | 2.6% |
Percentage of foreign born residents:
| Here: | 23.6% |
| San Francisco: | 33.2% |

Owner-occupied
Renter-occupied


- Rooms in owner-occupied houses and condos in Laurel Village
- 01 room
- 12 rooms
- 03 rooms
- 54 rooms
- 135 rooms
- 56 rooms
- 47 rooms
- 118 rooms
- 279+ rooms

- Rooms in renter-occupied apartments in Laurel Village
- 691 room
- 332 rooms
- 553 rooms
- 124 rooms
- 95 rooms
- 56 rooms
- 27 rooms
- 68 rooms
- 99+ rooms
Owner-occupied
Renter-occupied

- Bedrooms in owner-occupied houses and condos in Laurel Village
- 0no bedroom
- 11 bedroom
- 52 bedrooms
- 133 bedrooms
- 94 bedrooms
- 145+ bedrooms

- Bedrooms in renter-occupied apartments in Laurel Village
- 69no bedroom
- 881 bedroom
- 232 bedrooms
- 43 bedrooms
- 34 bedrooms
- 95+ bedrooms
Average number of cars or other vehicles available in houses/condos:
Average number of cars or other vehicles available in apartments:
| This neighborhood: | 1.2 |
| San Francisco: | 1.5 |
Average number of cars or other vehicles available in apartments:
| Here: | 0.4 |
| city: | 0.8 |
Percentage of units with a mortgage:
| Laurel Village: | 80.0% |
| San Francisco: | 62.3% |
Housing prices:
- Average estimated value of detached houses in 2022 (20.2% of all units):
Laurel Village: $6,467,664 San Francisco: $1,942,973
- Average estimated value of townhouses or other attached units in 2022 (2.1% of all units):
This neighborhood: $4,623,219 city: $1,528,422
- Average estimated value of housing units in 2-unit structures in 2022 (7.8% of all units):
This neighborhood: $4,657,739 San Francisco: $1,536,932
- Average estimated '22 value of housing units in 3-to-4-unit structures (6.6% of all units):
Laurel Village: $1,649,097 city: $1,622,965
- Average estimated '22 value of housing units in 5-or-more-unit structures (56.0% of all units):
Laurel Village: $2,001,071 San Francisco: $1,155,972

- Year house built in Laurel Village
- 02020 or later
- 02010 to 2019
- 272000 to 2009
- 101990 to 1999
- 201980 to 1989
- 351970 to 1979
- 51960 to 1969
- 221950 to 1959
- 31940 to 1949
- 1161939 or earlier

City-data.com crime index for city in 2020 (higher means more crime):
| City: | 387.4 |
| U.S. average: | 219.5 |
Travel time to work (commute)
![Travel time to work (commute)]()
- 2Less than 5 minutes
- 35 to 9 minutes
- 910 to 14 minutes
- 1215 to 19 minutes
- 1620 to 24 minutes
- 1025 to 29 minutes
- 2930 to 34 minutes
- 435 to 39 minutes
- 140 to 44 minutes
- 2045 to 59 minutes
- 660 to 89 minutes
- 690 or more minutes

Means of transportation to work
![Means of transportation to work]()
- 29.6%43Drove a car alone
- 6.9%10Carpooled
- 37.8%55Bus
- 3.4%5Long-distance train or commuter rail
- 8.3%12Taxi
- 3.4%5Bicycle
- 6.2%9Walked
- 0.7%1Other means
- 11.7%17Worked at home

Time leaving home to go to work
![Time leaving home to go to work]()
- 512:00 a.m. to 4:59 a.m.
- 15:30 a.m. to 5:59 a.m.
- 26:00 a.m. to 6:29 a.m.
- 76:30 a.m. to 6:59 a.m.
- 137:00 a.m. to 7:29 a.m.
- 177:30 a.m. to 7:59 a.m.
- 238:00 a.m. to 8:29 a.m.
- 98:30 a.m. to 8:59 a.m.
- 209:00 a.m. to 9:59 a.m.
- 410:00 a.m. to 10:59 a.m.

Occupations of males:
- Percentage of males in management occupations (except farmers):
Here: 12.8% city: 17.2%
- Percentage of males in business and financial operations occupations:
Here: 5.3% city: 8.9%
- Percentage of males in computer and mathematical occupations:
Here: 4.8% city: 14.6%
- Percentage of males in life, physical, and social science occupations:
Here: 6.4% city: 2.4%
- Percentage of males in legal occupations:
Here: 5.3% city: 2.5%
- Percentage of males in arts, design, entertainment, sports, and media occupations:
Here: 13.9% city: 4.9%
- Percentage of males in healthcare practitioners and technical occupations:
Here: 6.5% city: 3.2%
- Percentage of males in service occupations:
Here: 4.8% city: 11.8%
- Percentage of males in sales and office occupations:
Here: 32.6% city: 13.5%
- Percentage of males in production occupations:
Here: 10.2% city: 2.5%
- Percentage of males in material moving occupations:
Here: 3.7% city: 1.8%
Occupations of females:
- Percentage of females in management occupations (except farmers):
Here: 13.6% city: 15.8%
- Percentage of females in business and financial operations occupations:
Here: 9.3% city: 11.5%
- Percentage of females in computer and mathematical occupations:
Here: 10.7% city: 5.1%
- Percentage of females in life, physical, and social science occupations:
Here: 3.4% city: 2.9%
- Percentage of females in community and social services occupations:
Here: 30.0% city: 1.6%
- Percentage of females in legal occupations:
Here: 5.3% city: 3.0%
- Percentage of females in education, training, and library occupations:
Here: 5.7% city: 7.1%
- Percentage of females in arts, design, entertainment, sports, and media occupations:
Here: 13.6% city: 5.1%
- Percentage of females in healthcare practitioners and technical occupations:
Here: 6.4% city: 8.4%
- Percentage of females in service occupations:
Here: 6.5% city: 15.4%
- Percentage of females in sales and office occupations:
Here: 17.0% city: 19.3%
- Percentage of females in production occupations:
Here: 10.7% city: 1.5%
- Percentage of females in material moving occupations:
Here: 1.4% city: 0.8%
Education in this neighborhood (subdivision or community):
- Percentage of people 3 years and older in K-12 schools:
Laurel Village: 4.2% San Francisco: 9.7%
- Percentage of people 3 years and older in undergraduate colleges:
Laurel Village: 1.7% San Francisco: 4.8%
- Percentage of people 3 years and older in grad. or professional schools:
Laurel Village: 0.5% San Francisco: 2.6%
- Percentage of students K-12 enrolled in private schools:
Laurel Village: 82.4% San Francisco: 36.5%
Percentage of population below poverty level:
| Laurel Village: | 6.2% |
| San Francisco: | 10.4% |
Median year owner moved in (as recorded in 2022):
Median year renter moved in (as recorded in 2022):
| Laurel Village: | 2006 |
| San Francisco: | 2007 |
Median year renter moved in (as recorded in 2022):
| Laurel Village: | 2012 |
| San Francisco: | 2019 |
Percentage of married-couple families with both working:
| Laurel Village: | 77.4% |
| San Francisco: | 75.9% |

- 53.4%Electricity
- 38.7%Utility gas
- 2.2%Other fuel
- 2.0%Solar energy
- 1.9%Bottled, tank, or LP gas
- 1.7%No fuel used
Roads and streets:
California St
Length: 0.23 miles
Direction: E-W
Address range: 3400 to 3599
Direction: E-W
Address range: 3400 to 3599
Mayfair Dr
Length: 0.23 miles
Direction: E-W
Address range: 1 to 199
Direction: E-W
Address range: 1 to 199
Laurel St
Length: 0.05 miles
Direction: N-S
Address range: 500 to 530
Direction: N-S
Address range: 500 to 530
Spruce St
Length: 0.05 miles
Direction: N-S
Address range: 500 to 531
Direction: N-S
Address range: 500 to 531
Locust St
Length: 0.05 miles
Direction: N-S
Address range: 500 to 599
Direction: N-S
Address range: 500 to 599