Kimball neighborhood in Monroeville, Ohio (OH), 44847 detailed profile
Settings
X


Business Search - 14 Million verified businesses
Area: 4.121 square miles
Population: 244
Population density:
| Kimball: | 59 people per square mile |
| Monroeville: | 970 people per square mile |

- 24199.2%White
- 20.8%Two or more races

Median household income in 2022:
| Kimball: | $105,889 |
| Monroeville: | $65,625 |
Distribution of median household income
![Distribution of median household income]()
- 3Less than $10,000
- 4$10,000 to $19,999
- 6$20,000 to $29,999
- 12$30,000 to $39,999
- 10$40,000 to $49,999
- 7$50,000 to $59,999
- 5$60,000 to $74,999
- 22$75,000 to $99,999
- 4$100,000 to $124,999
- 20$125,000 to $149,999
- 17$150,000 to $199,999
- 3$200,000 or more

Distribution of owner-occupied house/condo value
![Distribution of owner-occupied house/condo value]()
- 13Less than $50,000
- 18$50,000 to $99,999
- 15$100,000 to $149,999
- 25$150,000 to $199,999
- 15$200,000 to $249,999
- 17$250,000 to $299,999
- 4$300,000 to $399,999
- 2$400,000 to $499,999
- 2$500,000 to $749,999
- 3$750,000 to $999,999

Distribution of rent paid by renters
![Distribution of rent paid by renters]()
- 2$500 to $599
- 1$600 to $699
- 5$700 to $799
- 1$800 to $899
- 1$900 to $999

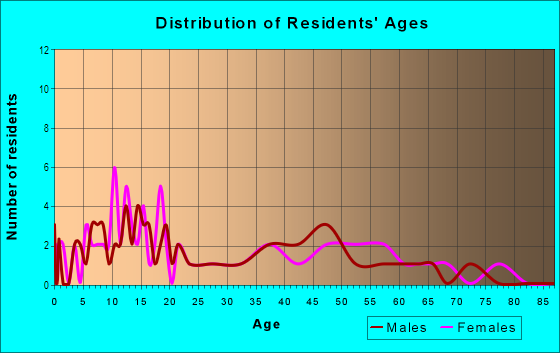
| Males: | 116 |
| Females: | 127 |
Males:
| This neighborhood: | 46.0 years |
| Whole city: | 33.4 years |
| This neighborhood: | 42.6 years |
| Whole city: | 40.5 years |
Average household size:
| Kimball: | 2.5 people |
| Monroeville: | 2.5 people |
Percentage of family households:
| Kimball: | 47.7% |
| Monroeville: | 51.0% |
| Here: | 71.1% |
| Monroeville: | 41.1% |
Percentage of married-couple families with children (among all households):
| Kimball: | 33.4% |
| Monroeville: | 13.5% |
Percentage of single-mother households (among all households):
| Kimball: | 5.7% |
| Monroeville: | 10.1% |
Percentage of never married males 15 years old and over:
Percentage of never married females 15 years old and over:
| Kimball: | 14.3% |
| Monroeville: | 15.2% |
Percentage of never married females 15 years old and over:
| Kimball: | 6.3% |
| village: | 9.5% |
Percentage of people that speak English not well or not at all:
| Kimball: | 0.0% |
| Monroeville: | 0.0% |
Percentage of people born in this state:
Percentage of people born in another U.S. state:
Percentage of native residents but born outside the U.S.:
Percentage of foreign born residents:
| Here: | 87.2% |
| Monroeville: | 87.0% |
Percentage of people born in another U.S. state:
| Kimball: | 12.1% |
| Monroeville: | 11.3% |
Percentage of native residents but born outside the U.S.:
| Here: | 0.2% |
| village: | 0.5% |
Percentage of foreign born residents:
| Here: | 0.6% |
| Monroeville: | 1.2% |

Owner-occupied
Renter-occupied


- Rooms in owner-occupied houses and condos in Kimball
- 31 room
- 12 rooms
- 03 rooms
- 44 rooms
- 125 rooms
- 266 rooms
- 137 rooms
- 38 rooms
- 419+ rooms

- Rooms in renter-occupied apartments in Kimball
- 01 room
- 02 rooms
- 03 rooms
- 24 rooms
- 05 rooms
- 16 rooms
- 37 rooms
- 08 rooms
- 09+ rooms
Owner-occupied
Renter-occupied

- Bedrooms in owner-occupied houses and condos in Kimball
- 3no bedroom
- 01 bedroom
- 92 bedrooms
- 533 bedrooms
- 244 bedrooms
- 95+ bedrooms

- Bedrooms in renter-occupied apartments in Kimball
- 0no bedroom
- 01 bedroom
- 32 bedrooms
- 13 bedrooms
- 34 bedrooms
- 05+ bedrooms
Average number of cars or other vehicles available in houses/condos:
Average number of cars or other vehicles available in apartments:
| This neighborhood: | 2.5 |
| Monroeville: | 1.9 |
Average number of cars or other vehicles available in apartments:
| Here: | |
| village: |
Percentage of units with a mortgage:
| Kimball: | 47.9% |
| Monroeville: | 66.0% |
Average estimated value of detached houses in 2022 (100.0% of all units):
| Kimball: | $170,945 |
| Monroeville: | $126,671 |

- Year house built in Kimball
- 02020 or later
- 42010 to 2019
- 112000 to 2009
- 231990 to 1999
- 31980 to 1989
- 111970 to 1979
- 51960 to 1969
- 21950 to 1959
- 121940 to 1949
- 471939 or earlier

City-data.com crime index for village in 2020 (higher means more crime):
| City: | 71.4 |
| U.S. average: | 219.5 |
Travel time to work (commute)
![Travel time to work (commute)]()
- 4Less than 5 minutes
- 105 to 9 minutes
- 910 to 14 minutes
- 1915 to 19 minutes
- 1220 to 24 minutes
- 925 to 29 minutes
- 530 to 34 minutes
- 140 to 44 minutes
- 345 to 59 minutes
- 360 to 89 minutes
- 290 or more minutes

Means of transportation to work
![Means of transportation to work]()
- 77.8%94Drove a car alone
- 7.4%9Carpooled
- 9.1%11Bus
- 4.1%5Motorcycle
- 3.3%4Walked
- 6.6%8Worked at home

Time leaving home to go to work
![Time leaving home to go to work]()
- 312:00 a.m. to 4:59 a.m.
- 45:00 a.m. to 5:29 a.m.
- 65:30 a.m. to 5:59 a.m.
- 56:00 a.m. to 6:29 a.m.
- 166:30 a.m. to 6:59 a.m.
- 127:00 a.m. to 7:29 a.m.
- 67:30 a.m. to 7:59 a.m.
- 48:00 a.m. to 8:29 a.m.
- 48:30 a.m. to 8:59 a.m.
- 59:00 a.m. to 9:59 a.m.
- 110:00 a.m. to 10:59 a.m.
- 112:00 p.m. to 3:59 p.m.
- 74:00 p.m. to 11:59 p.m.

Occupations of males:
- Percentage of males in management occupations (except farmers):
Here: 8.9% village: 5.2%
- Percentage of males in computer and mathematical occupations:
Here: 1.0% village: 0.0%
- Percentage of males in architecture and engineering occupations:
Here: 6.5% village: 0.0%
- Percentage of males in community and social services occupations:
Here: 1.0% village: 0.9%
- Percentage of males in education, training, and library occupations:
Here: 3.9% village: 7.8%
- Percentage of males in service occupations:
Here: 5.9% village: 9.2%
- Percentage of males in sales and office occupations:
Here: 9.3% village: 11.5%
- Percentage of males in construction, extraction, and maintenance occupations:
Here: 20.5% village: 17.0%
- Percentage of males in production occupations:
Here: 24.0% village: 22.5%
- Percentage of males in transportation occupations:
Here: 3.6% village: 8.1%
- Percentage of males in material moving occupations:
Here: 15.4% village: 4.0%
Occupations of females:
- Percentage of females in management occupations (except farmers):
Here: 2.8% village: 19.3%
- Percentage of females in business and financial operations occupations:
Here: 6.7% village: 1.0%
- Percentage of females in education, training, and library occupations:
Here: 11.6% village: 10.5%
- Percentage of females in healthcare practitioners and technical occupations:
Here: 18.2% village: 10.5%
- Percentage of females in service occupations:
Here: 6.7% village: 15.9%
- Percentage of females in sales and office occupations:
Here: 35.2% village: 19.6%
- Percentage of females in production occupations:
Here: 20.6% village: 7.8%
- Percentage of females in material moving occupations:
Here: 2.0% village: 3.0%
Education in this neighborhood (subdivision or community):
- Percentage of people 3 years and older in K-12 schools:
Kimball: 11.6% Monroeville: 23.6%
- Percentage of people 3 years and older in undergraduate colleges:
Kimball: 9.4% Monroeville: 2.8%
- Percentage of people 3 years and older in grad. or professional schools:
Kimball: 0.9% Monroeville: 0.7%
- Percentage of students K-12 enrolled in private schools:
Kimball: 0.0% Monroeville: 1.6%
Percentage of population below poverty level:
| Kimball: | 4.9% |
| Monroeville: | 7.1% |
Median year owner moved in (as recorded in 2022):
| Kimball: | 2003 |
| Monroeville: | 1999 |
Percentage of married-couple families with both working:
| Kimball: | 100.0% |
| Monroeville: | 56.9% |

- 36.9%Utility gas
- 20.2%Bottled, tank, or LP gas
- 15.5%Electricity
- 14.7%Other fuel
- 9.2%Wood
- 3.3%Fuel oil, kerosene, etc.
Highways in this neighborhood:
State Rte 113 W (Strongridge Rd, State Rte 113)
Length: 2.42 miles
Direction: E-W
Address range: 2857 to 6799
Direction: E-W
Address range: 2857 to 6799
Skadden Rd (State Rte 99 N)
Length: 0.05 miles
Directions: N-S, SE-NW
Address range: 11100 to 11699
Directions: N-S, SE-NW
Address range: 11100 to 11699
Roads and streets:
Co Hwy 43 (Patten Tract Rd)
Length: 1.94 miles
Directions: N-S, SW-NE
Address range: 10605 to 13499
Directions: N-S, SW-NE
Address range: 10605 to 13499
Ransom Rd (Twp Hwy 44)
Length: 1.76 miles
Direction: N-S
Address range: 10205 to 12099
Direction: N-S
Address range: 10205 to 12099
Delematre Rd (Twp Hwy 93)
Length: 1.63 miles
Directions: E-W, N-S, SW-NE
Address range: 4300 to 5699
Directions: E-W, N-S, SW-NE
Address range: 4300 to 5699
Co Hwy 15 (Strecker Rd, Strecker Rd W)
Length: 0.13 miles
Direction: E-W
Address range: 5624 to 5749
Direction: E-W
Address range: 5624 to 5749
Railroad features:
Norfolk and Western Rlwy
Length: 0.44 miles
Direction: E-W
Direction: E-W
Highways in this neighborhood:
State Rte 113 (State Rte 113 W, Strongridge Rd)
Length: 2.42 miles
Direction: E-W
Address range: 2857 to 6799
Direction: E-W
Address range: 2857 to 6799
Roads and streets:
Twp Hwy 218 (Limbird Rd)
Length: 0.02 miles
Direction: SW-NE
Address range: 5379 to 5399
Direction: SW-NE
Address range: 5379 to 5399