John Hope Homes neighborhood in Atlanta, Georgia (GA), 30313, 30314 detailed profile
Settings
X


Business Search - 14 Million verified businesses
Area: 0.093 square miles
Population: 606
Population density:
| John Hope Homes: | 6,544 people per square mile |
| Atlanta: | 3,788 people per square mile |

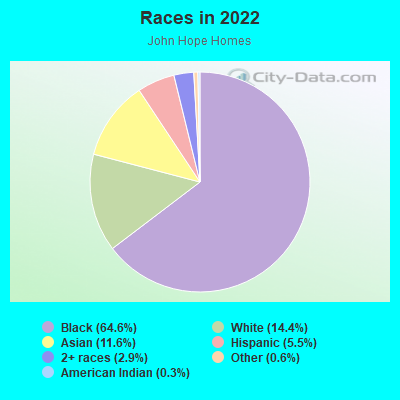
- 42264.6%Black
- 9414.4%White
- 7611.6%Asian
- 365.5%Hispanic or Latino
- 192.9%Two or more races
- 40.6%Some other race
- 20.3%American Indian
Distribution of median household income
![Distribution of median household income]()
- 31Less than $10,000
- 187$10,000 to $19,999
- 159$20,000 to $29,999
- 50$30,000 to $39,999
- 25$40,000 to $49,999
- 97$50,000 to $59,999
- 34$60,000 to $74,999
- 19$75,000 to $99,999
- 6$100,000 to $124,999
- 8$125,000 to $149,999
- 15$150,000 to $199,999
- 3$200,000 or more

Distribution of owner-occupied house/condo value
![Distribution of owner-occupied house/condo value]()
- 3Less than $50,000
- 3$50,000 to $99,999
- 2$100,000 to $149,999
- 7$150,000 to $199,999
- 3$200,000 to $249,999
- 8$250,000 to $299,999
- 12$300,000 to $399,999
- 12$400,000 to $499,999
- 9$500,000 to $749,999

Distribution of rent paid by renters
![Distribution of rent paid by renters]()
- 209Less than $100
- 116$100 to $199
- 21$300 to $399
- 73$400 to $499
- 26$500 to $599
- 100$600 to $699
- 5$700 to $799
- 6$800 to $899
- 26$900 to $999
- 33$1,000 to $1,249
- 13$1,250 to $1,499
- 3$1,500 to $1,999

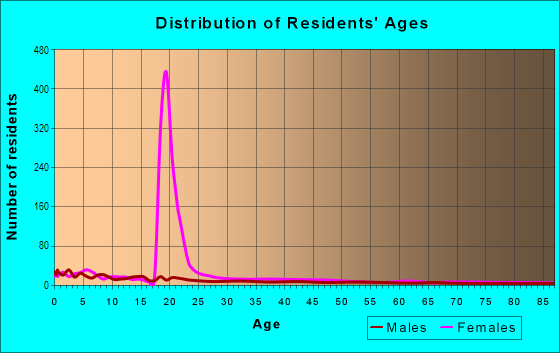
| Males: | 189 |
| Females: | 521 |
Males:
| This neighborhood: | |
| Whole city: |
| This neighborhood: | 34.1 years |
| Whole city: | 34.3 years |
Percentage of family households:
| John Hope Homes: | 18.0% |
| Atlanta: | 31.6% |
| Here: | 9.0% |
| Atlanta: | 24.9% |
Percentage of married-couple families with children (among all households):
| John Hope Homes: | 14.7% |
| Atlanta: | 23.2% |
Percentage of single-mother households (among all households):
| John Hope Homes: | 34.4% |
| Atlanta: | 22.0% |
Percentage of never married males 15 years old and over:
Percentage of never married females 15 years old and over:
| John Hope Homes: | 15.8% |
| Atlanta: | 28.0% |
Percentage of never married females 15 years old and over:
| John Hope Homes: | 74.5% |
| city: | 26.3% |
Percentage of people that speak English not well or not at all:
| John Hope Homes: | 0.2% |
| Atlanta: | 1.0% |
Percentage of people born in this state:
Percentage of people born in another U.S. state:
Percentage of native residents but born outside the U.S.:
Percentage of foreign born residents:
| Here: | 39.2% |
| Atlanta: | 46.3% |
Percentage of people born in another U.S. state:
| John Hope Homes: | 53.4% |
| Atlanta: | 43.2% |
Percentage of native residents but born outside the U.S.:
| Here: | 2.5% |
| city: | 2.0% |
Percentage of foreign born residents:
| Here: | 8.1% |
| Atlanta: | 8.5% |
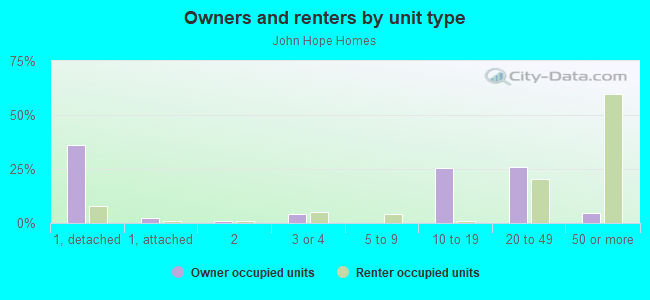
Owner-occupied
Renter-occupied

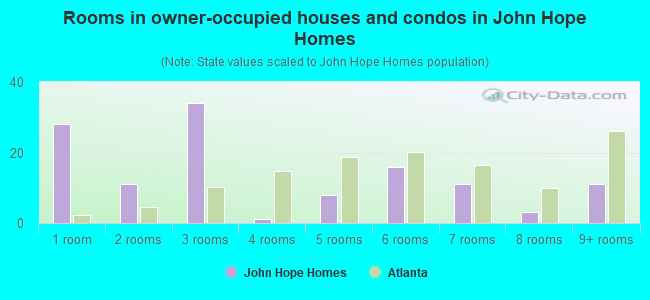
- Rooms in owner-occupied houses and condos in John Hope Homes
- 281 room
- 112 rooms
- 343 rooms
- 14 rooms
- 85 rooms
- 166 rooms
- 117 rooms
- 38 rooms
- 119+ rooms
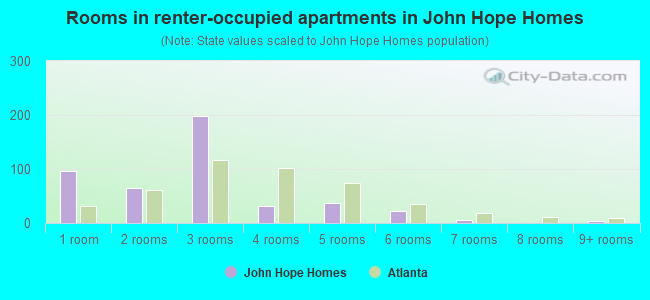
- Rooms in renter-occupied apartments in John Hope Homes
- 961 room
- 652 rooms
- 1993 rooms
- 324 rooms
- 375 rooms
- 236 rooms
- 57 rooms
- 08 rooms
- 39+ rooms
Owner-occupied
Renter-occupied
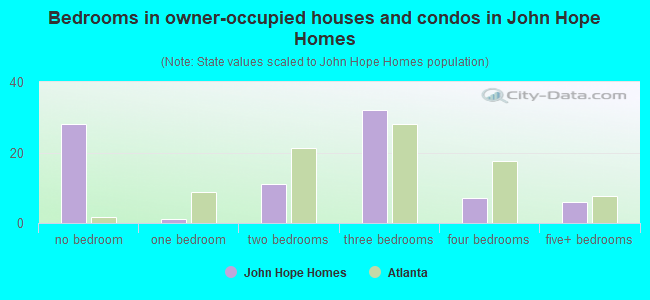
- Bedrooms in owner-occupied houses and condos in John Hope Homes
- 28no bedroom
- 11 bedroom
- 112 bedrooms
- 323 bedrooms
- 74 bedrooms
- 65+ bedrooms
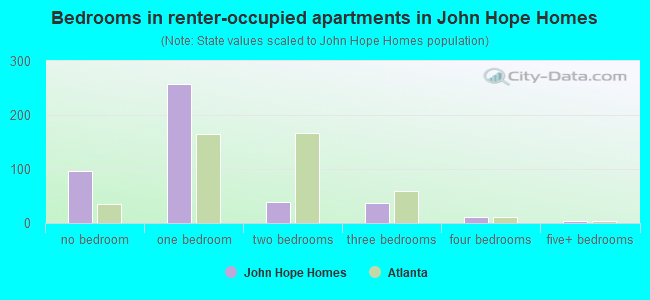
- Bedrooms in renter-occupied apartments in John Hope Homes
- 96no bedroom
- 2571 bedroom
- 392 bedrooms
- 373 bedrooms
- 114 bedrooms
- 35+ bedrooms
Average number of cars or other vehicles available in houses/condos:
Average number of cars or other vehicles available in apartments:
| This neighborhood: | |
| Atlanta: |
Average number of cars or other vehicles available in apartments:
| Here: | |
| city: |
Percentage of units with a mortgage:
| John Hope Homes: | 78.3% |
| Atlanta: | 72.0% |
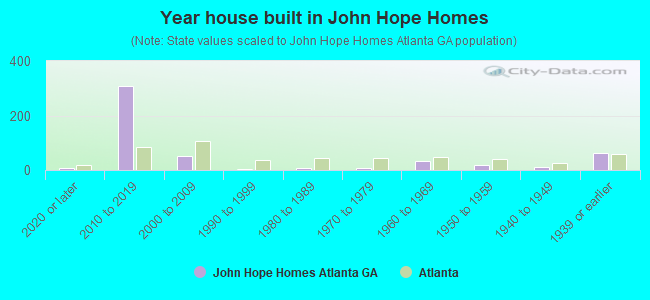
- Year house built in John Hope Homes
- 62020 or later
- 3072010 to 2019
- 522000 to 2009
- 21990 to 1999
- 91980 to 1989
- 71970 to 1979
- 341960 to 1969
- 171950 to 1959
- 101940 to 1949
- 631939 or earlier
City-data.com crime index for city in 2020 (higher means more crime):
| City: | 140.2 |
| U.S. average: | 219.5 |
Travel time to work (commute)
![Travel time to work (commute)]()
- 14Less than 5 minutes
- 25 to 9 minutes
- 1910 to 14 minutes
- 3015 to 19 minutes
- 1820 to 24 minutes
- 1125 to 29 minutes
- 2530 to 34 minutes
- 2335 to 39 minutes
- 440 to 44 minutes
- 1145 to 59 minutes
- 960 to 89 minutes
- 1490 or more minutes

Means of transportation to work
![Means of transportation to work]()
- 33.1%43Drove a car alone
- 13.1%17Carpooled
- 5.4%7Bus
- 19.2%25Subway or elevated rail
- 31.5%41Taxi
- 2.3%3Bicycle
- 26.9%35Walked
- 8.5%11Other means
- 34.6%45Worked at home

Time leaving home to go to work
![Time leaving home to go to work]()
- 312:00 a.m. to 4:59 a.m.
- 95:00 a.m. to 5:29 a.m.
- 35:30 a.m. to 5:59 a.m.
- 86:00 a.m. to 6:29 a.m.
- 136:30 a.m. to 6:59 a.m.
- 177:00 a.m. to 7:29 a.m.
- 197:30 a.m. to 7:59 a.m.
- 188:00 a.m. to 8:29 a.m.
- 58:30 a.m. to 8:59 a.m.
- 169:00 a.m. to 9:59 a.m.
- 310:00 a.m. to 10:59 a.m.
- 411:00 a.m. to 11:59 a.m.
- 2712:00 p.m. to 3:59 p.m.
- 244:00 p.m. to 11:59 p.m.

Occupations of males:
- Percentage of males in management occupations (except farmers):
Here: 2.6% city: 16.5%
- Percentage of males in computer and mathematical occupations:
Here: 9.3% city: 8.5%
- Percentage of males in legal occupations:
Here: 2.4% city: 3.3%
- Percentage of males in service occupations:
Here: 4.4% city: 11.5%
- Percentage of males in sales and office occupations:
Here: 40.5% city: 15.1%
- Percentage of males in farming, fishing, and forestry occupations:
Here: 1.3% city: 0.2%
- Percentage of males in construction, extraction, and maintenance occupations:
Here: 2.9% city: 2.4%
- Percentage of males in production occupations:
Here: 1.1% city: 1.9%
- Percentage of males in material moving occupations:
Here: 42.4% city: 4.3%
Occupations of females:
- Percentage of females in management occupations (except farmers):
Here: 11.1% city: 14.0%
- Percentage of females in business and financial operations occupations:
Here: 18.0% city: 10.8%
- Percentage of females in life, physical, and social science occupations:
Here: 4.3% city: 1.9%
- Percentage of females in education, training, and library occupations:
Here: 21.3% city: 8.9%
- Percentage of females in service occupations:
Here: 12.8% city: 13.9%
- Percentage of females in sales and office occupations:
Here: 36.0% city: 21.9%
- Percentage of females in transportation occupations:
Here: 4.6% city: 2.2%
- Percentage of females in material moving occupations:
Here: 3.8% city: 1.6%
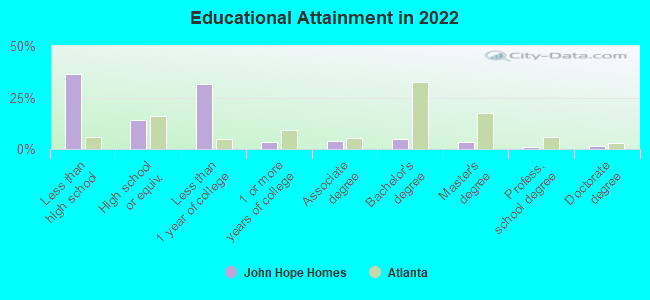
Education in this neighborhood (subdivision or community):
- Percentage of people 3 years and older in K-12 schools:
John Hope Homes: 26.1% Atlanta: 12.5%
- Percentage of people 3 years and older in undergraduate colleges:
John Hope Homes: 174.7% Atlanta: 8.9%
- Percentage of people 3 years and older in grad. or professional schools:
John Hope Homes: 2.3% Atlanta: 3.3%
- Percentage of students K-12 enrolled in private schools:
John Hope Homes: 1.9% Atlanta: 22.5%
Percentage of population below poverty level:
| John Hope Homes: | 23.5% |
| Atlanta: | 17.3% |
Percentage of married-couple families with both working:
| John Hope Homes: | 87.1% |
| Atlanta: | 79.0% |
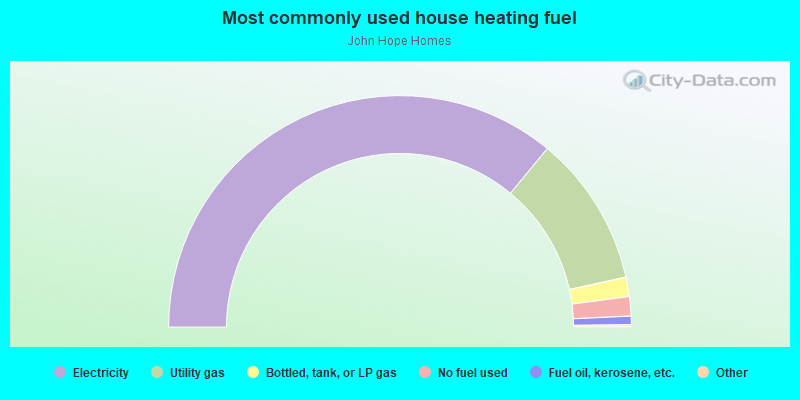
- 72.0%Electricity
- 21.1%Utility gas
- 2.7%Bottled, tank, or LP gas
- 2.7%No fuel used
- 1.2%Fuel oil, kerosene, etc.
Highways in this neighborhood:
US Hwy 19 (State Rte 3, US Hwy 29, US Hwy 41, Northside Dr SW)
Length: 0.27 miles
Direction: SW-NE
Address range: 31 to 384
Direction: SW-NE
Address range: 31 to 384
Roads and streets:
Greensferry Ave SW
Length: 0.22 miles
Directions: E-W, SE-NW, SW-NE
Address range: 500 to 666
Directions: E-W, SE-NW, SW-NE
Address range: 500 to 666
Roach St SW
Length: 0.17 miles
Directions: N-S, SW-NE
Address range: 100 to 299
Directions: N-S, SW-NE
Address range: 100 to 299
Dora St SW
Length: 0.11 miles
Directions: N-S, SE-NW
Address range: 200 to 609
Directions: N-S, SE-NW
Address range: 200 to 609
Leonard St SW
Length: 0.08 miles
Direction: SE-NW
Address range: 384 to 499
Direction: SE-NW
Address range: 384 to 499
Harrison Pl SW
Length: 0.08 miles
Direction: E-W
Address range: 600 to 699
Direction: E-W
Address range: 600 to 699
Fair St SW
Length: 0.07 miles
Direction: E-W
Address range: 656 to 696
Direction: E-W
Address range: 656 to 696
Elm St SW
Length: 0.07 miles
Direction: N-S
Address range: 154 to 203
Direction: N-S
Address range: 154 to 203
John Hope Dr SW
Length: 0.07 miles
Direction: N-S
Address range: 151 to 199
Direction: N-S
Address range: 151 to 199
Larkin St SW
Length: 0.05 miles
Direction: E-W
Address range: 659 to 675
Direction: E-W
Address range: 659 to 675
Spelman Ln SW
Length: 0.03 miles
Direction: SE-NW
Direction: SE-NW
Railroad features:
Csx RR
Length: 0.06 miles
Direction: E-W
Direction: E-W
Norfolk Southern Rlwy
Length: 0.03 miles
Direction: SW-NE
Direction: SW-NE