Jefferson neighborhood in Villa Park, Illinois (IL), 60101, 60181 detailed profile
Settings
X


Business Search - 14 Million verified businesses
Area: 0.987 square miles
Population: 5,250
Population density:
| Jefferson: | 5,317 people per square mile |
| Villa Park: | 4,839 people per square mile |

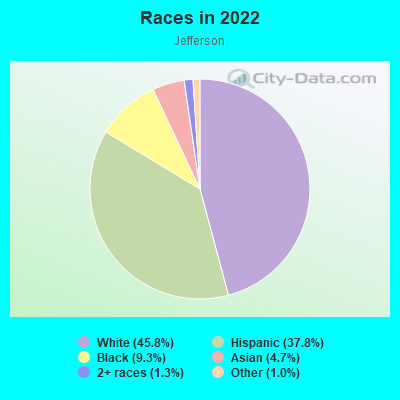
- 2,50845.8%White
- 2,07037.8%Hispanic or Latino
- 5089.3%Black
- 2574.7%Asian
- 711.3%Two or more races
- 541.0%Some other race
- 50.09%American Indian
Median household income in 2022:
| Jefferson: | $75,924 |
| Villa Park: | $90,287 |
Distribution of median household income
![Distribution of median household income]()
- 184Less than $10,000
- 114$10,000 to $19,999
- 235$20,000 to $29,999
- 187$30,000 to $39,999
- 172$40,000 to $49,999
- 212$50,000 to $59,999
- 276$60,000 to $74,999
- 399$75,000 to $99,999
- 252$100,000 to $124,999
- 144$125,000 to $149,999
- 257$150,000 to $199,999
- 155$200,000 or more

Distribution of owner-occupied house/condo value
![Distribution of owner-occupied house/condo value]()
- 115Less than $50,000
- 33$50,000 to $99,999
- 122$100,000 to $149,999
- 269$150,000 to $199,999
- 297$200,000 to $249,999
- 504$250,000 to $299,999
- 208$300,000 to $399,999
- 23$400,000 to $499,999
- 99$500,000 to $749,999
- 16$750,000 to $999,999
- 50$1,000,000 or more

Distribution of rent paid by renters
![Distribution of rent paid by renters]()
- 91$200 to $299
- 44$300 to $399
- 72$400 to $499
- 104$700 to $799
- 46$800 to $899
- 335$900 to $999
- 365$1,000 to $1,249
- 130$1,250 to $1,499
- 254$1,500 to $1,999
- 131$2,000 or more

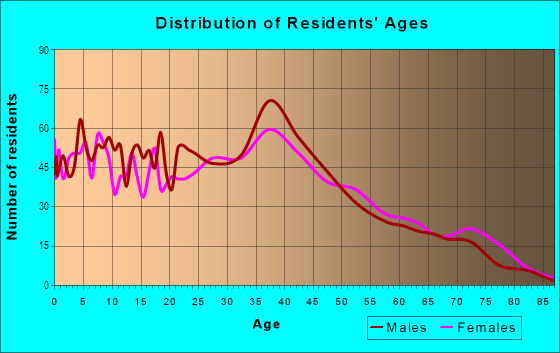
| Males: | 2,657 |
| Females: | 2,593 |
Males:
| This neighborhood: | 38.1 years |
| Whole city: | 36.7 years |
| This neighborhood: | 34.6 years |
| Whole city: | 35.3 years |
Average household size:
| Jefferson: | 2.6 people |
| Villa Park: | 2.8 people |
Percentage of family households:
| Jefferson: | 55.7% |
| Villa Park: | 53.3% |
| Here: | 47.8% |
| Villa Park: | 54.9% |
Percentage of married-couple families with children (among all households):
| Jefferson: | 27.1% |
| Villa Park: | 29.0% |
Percentage of single-mother households (among all households):
| Jefferson: | 8.6% |
| Villa Park: | 4.0% |
Percentage of never married males 15 years old and over:
Percentage of never married females 15 years old and over:
| Jefferson: | 19.7% |
| Villa Park: | 19.9% |
Percentage of never married females 15 years old and over:
| Jefferson: | 16.2% |
| village: | 14.9% |
Percentage of people that speak English not well or not at all:
| Jefferson: | 4.7% |
| Villa Park: | 4.4% |
Percentage of people born in this state:
Percentage of people born in another U.S. state:
Percentage of native residents but born outside the U.S.:
Percentage of foreign born residents:
| Here: | 66.3% |
| Villa Park: | 69.9% |
Percentage of people born in another U.S. state:
| Jefferson: | 13.3% |
| Villa Park: | 12.9% |
Percentage of native residents but born outside the U.S.:
| Here: | 1.0% |
| village: | 1.1% |
Percentage of foreign born residents:
| Here: | 19.4% |
| Villa Park: | 16.0% |
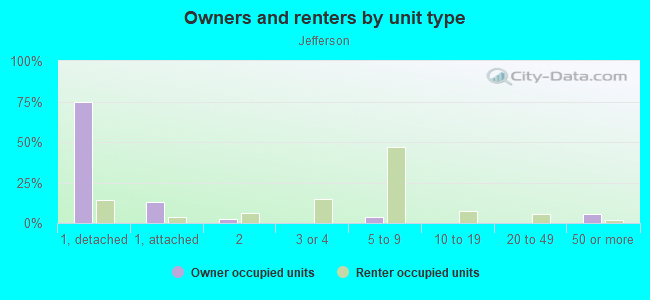
Owner-occupied
Renter-occupied

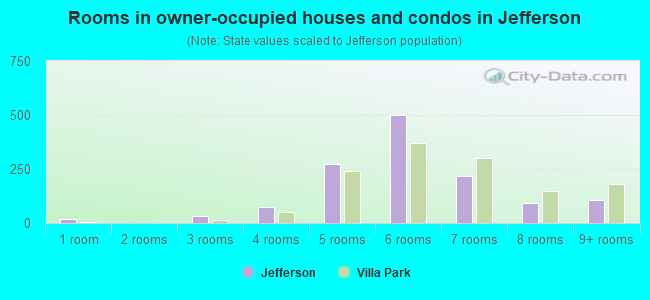
- Rooms in owner-occupied houses and condos in Jefferson
- 181 room
- 02 rooms
- 323 rooms
- 734 rooms
- 2715 rooms
- 5026 rooms
- 2177 rooms
- 938 rooms
- 1059+ rooms
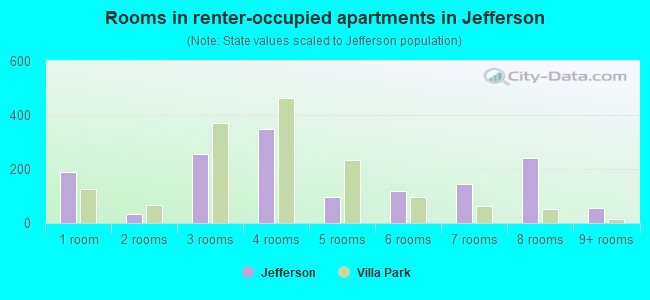
- Rooms in renter-occupied apartments in Jefferson
- 1901 room
- 342 rooms
- 2563 rooms
- 3474 rooms
- 985 rooms
- 1176 rooms
- 1467 rooms
- 2428 rooms
- 579+ rooms
Owner-occupied
Renter-occupied
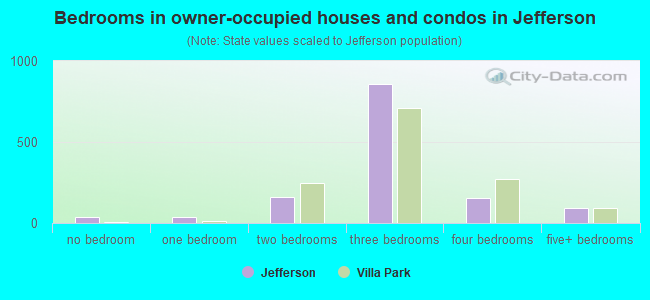
- Bedrooms in owner-occupied houses and condos in Jefferson
- 40no bedroom
- 341 bedroom
- 1632 bedrooms
- 8583 bedrooms
- 1544 bedrooms
- 945+ bedrooms
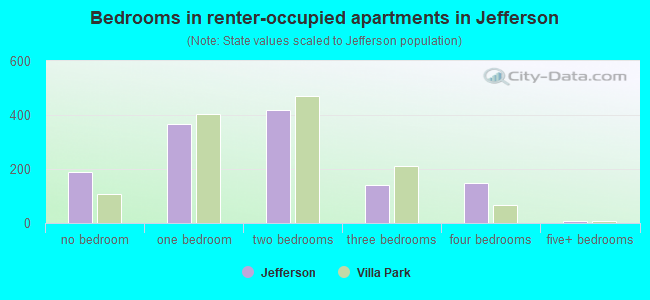
- Bedrooms in renter-occupied apartments in Jefferson
- 190no bedroom
- 3671 bedroom
- 4182 bedrooms
- 1393 bedrooms
- 1484 bedrooms
- 75+ bedrooms
Average number of cars or other vehicles available in houses/condos:
Average number of cars or other vehicles available in apartments:
| This neighborhood: | 1.9 |
| Villa Park: | 2.1 |
Average number of cars or other vehicles available in apartments:
| Here: | 1.9 |
| village: | 1.6 |
Percentage of units with a mortgage:
| Jefferson: | 73.8% |
| Villa Park: | 67.0% |
Average estimated value of detached houses in 2022 (63.3% of all units):
| Jefferson: | $263,529 |
| Villa Park: | $305,514 |
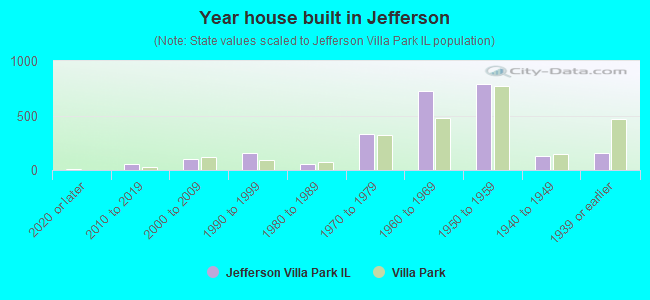
- Year house built in Jefferson
- 82020 or later
- 532010 to 2019
- 1022000 to 2009
- 1551990 to 1999
- 531980 to 1989
- 3291970 to 1979
- 7211960 to 1969
- 7921950 to 1959
- 1301940 to 1949
- 1531939 or earlier
City-data.com crime index for village in 2020 (higher means more crime):
| City: | 147.7 |
| U.S. average: | 219.5 |
Travel time to work (commute)
![Travel time to work (commute)]()
- 4Less than 5 minutes
- 2565 to 9 minutes
- 37710 to 14 minutes
- 34815 to 19 minutes
- 34620 to 24 minutes
- 23925 to 29 minutes
- 30030 to 34 minutes
- 6335 to 39 minutes
- 15940 to 44 minutes
- 34145 to 59 minutes
- 8960 to 89 minutes
- 7390 or more minutes

Means of transportation to work
![Means of transportation to work]()
- 79.0%2,152Drove a car alone
- 5.9%160Carpooled
- 0.2%5Bus
- 5.8%159Subway or elevated rail
- 4.3%116Long-distance train or commuter rail
- 1.6%43Taxi
- 1.1%30Bicycle
- 1.5%41Walked
- 0.6%16Other means
- 10.6%288Worked at home

Time leaving home to go to work
![Time leaving home to go to work]()
- 15012:00 a.m. to 4:59 a.m.
- 1105:00 a.m. to 5:29 a.m.
- 1395:30 a.m. to 5:59 a.m.
- 1826:00 a.m. to 6:29 a.m.
- 3406:30 a.m. to 6:59 a.m.
- 3087:00 a.m. to 7:29 a.m.
- 2447:30 a.m. to 7:59 a.m.
- 2468:00 a.m. to 8:29 a.m.
- 748:30 a.m. to 8:59 a.m.
- 1699:00 a.m. to 9:59 a.m.
- 9310:00 a.m. to 10:59 a.m.
- 3511:00 a.m. to 11:59 a.m.
- 27112:00 p.m. to 3:59 p.m.
- 1804:00 p.m. to 11:59 p.m.

Occupations of males:
- Percentage of males in management occupations (except farmers):
Here: 10.1% village: 12.0%
- Percentage of males in computer and mathematical occupations:
Here: 3.9% village: 4.9%
- Percentage of males in architecture and engineering occupations:
Here: 2.2% village: 3.5%
- Percentage of males in legal occupations:
Here: 1.3% village: 1.2%
- Percentage of males in education, training, and library occupations:
Here: 2.5% village: 4.2%
- Percentage of males in service occupations:
Here: 15.7% village: 13.2%
- Percentage of males in sales and office occupations:
Here: 11.9% village: 15.9%
- Percentage of males in construction, extraction, and maintenance occupations:
Here: 13.2% village: 7.8%
- Percentage of males in production occupations:
Here: 17.7% village: 10.9%
- Percentage of males in transportation occupations:
Here: 10.6% village: 6.1%
- Percentage of males in material moving occupations:
Here: 7.3% village: 7.5%
Occupations of females:
- Percentage of females in management occupations (except farmers):
Here: 4.0% village: 9.4%
- Percentage of females in business and financial operations occupations:
Here: 5.1% village: 7.3%
- Percentage of females in computer and mathematical occupations:
Here: 1.6% village: 1.4%
- Percentage of females in community and social services occupations:
Here: 4.7% village: 1.6%
- Percentage of females in legal occupations:
Here: 2.9% village: 0.7%
- Percentage of females in education, training, and library occupations:
Here: 5.5% village: 7.5%
- Percentage of females in arts, design, entertainment, sports, and media occupations:
Here: 3.5% village: 2.5%
- Percentage of females in healthcare practitioners and technical occupations:
Here: 7.2% village: 8.6%
- Percentage of females in service occupations:
Here: 28.4% village: 21.1%
- Percentage of females in sales and office occupations:
Here: 24.0% village: 29.7%
- Percentage of females in production occupations:
Here: 7.1% village: 3.7%
- Percentage of females in transportation occupations:
Here: 2.1% village: 1.5%
- Percentage of females in material moving occupations:
Here: 3.6% village: 3.9%
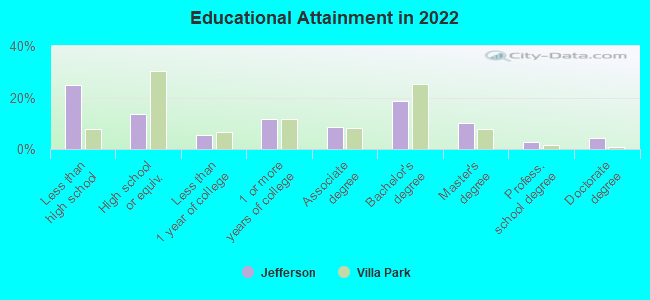
Education in this neighborhood (subdivision or community):
- Percentage of people 3 years and older in K-12 schools:
Jefferson: 22.9% Villa Park: 17.1%
- Percentage of people 3 years and older in undergraduate colleges:
Jefferson: 3.3% Villa Park: 4.9%
- Percentage of people 3 years and older in grad. or professional schools:
Jefferson: 3.0% Villa Park: 1.4%
- Percentage of students K-12 enrolled in private schools:
Jefferson: 17.9% Villa Park: 15.5%
Percentage of population below poverty level:
| Jefferson: | 5.5% |
| Villa Park: | 4.9% |
Median year owner moved in (as recorded in 2022):
Median year renter moved in (as recorded in 2022):
| Jefferson: | 2004 |
| Villa Park: | 2005 |
Median year renter moved in (as recorded in 2022):
| Jefferson: | 2015 |
| Villa Park: | 2015 |
Percentage of married-couple families with both working:
| Jefferson: | 96.0% |
| Villa Park: | 72.9% |
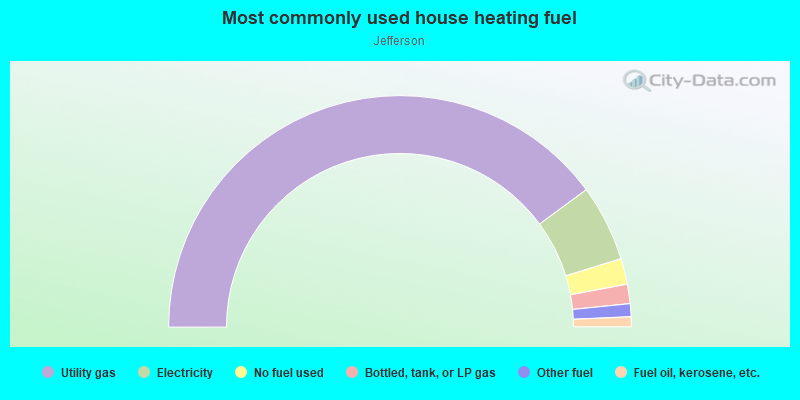
- 79.7%Utility gas
- 10.7%Electricity
- 3.6%No fuel used
- 2.7%Bottled, tank, or LP gas
- 1.8%Other fuel
- 1.4%Fuel oil, kerosene, etc.
Highways in this neighborhood:
Main St (State Rte 64)
Length: 0.57 miles
Direction: E-W
Address range: 451 to 813
Direction: E-W
Address range: 451 to 813
State Rte 64
Length: 0.08 miles
Direction: E-W
Address range: 400 to 449
Direction: E-W
Address range: 400 to 449
Roads and streets:
Chicago Central and Pacific RR
Length: 1.76 miles
Directions: E-W, SE-NW
Directions: E-W, SE-NW
W Vermont St
Length: 1.29 miles
Directions: E-W, SE-NW
Address range: 1 to 739
Directions: E-W, SE-NW
Address range: 1 to 739
W Ridge Rd
Length: 1.19 miles
Directions: E-W, SW-NE
Address range: 1 to 799
Directions: E-W, SW-NE
Address range: 1 to 799
W Sunset Dr
Length: 1.08 miles
Directions: E-W, SW-NE
Address range: 112 to 743
Directions: E-W, SW-NE
Address range: 112 to 743
W Plymouth St
Length: 1.00 miles
Direction: E-W
Address range: 2 to 552
Direction: E-W
Address range: 2 to 552
W Terrace St
Length: 0.85 miles
Directions: E-W, SW-NE
Address range: 1 to 745
Directions: E-W, SW-NE
Address range: 1 to 745
N Westmore Ave
Length: 0.72 miles
Direction: N-S
Address range: 298 to 757
Direction: N-S
Address range: 298 to 757
N Lincoln Ave
Length: 0.72 miles
Directions: N-S, SE-NW
Address range: 298 to 751
Directions: N-S, SE-NW
Address range: 298 to 751
N Addison Rd
Length: 0.70 miles
Directions: N-S, SE-NW
Address range: 324 to 799
Directions: N-S, SE-NW
Address range: 324 to 799
Biermann Ave
Length: 0.70 miles
Direction: N-S
Address range: 318 to 758
Direction: N-S
Address range: 318 to 758
E Vermont St
Length: 0.68 miles
Direction: E-W
Address range: 1 to 399
Direction: E-W
Address range: 1 to 399
E Plymouth St
Length: 0.68 miles
Direction: E-W
Address range: 1 to 334
Direction: E-W
Address range: 1 to 334
N 2nd Ave
Length: 0.67 miles
Direction: N-S
Address range: 320 to 765
Direction: N-S
Address range: 320 to 765
N 3rd Ave
Length: 0.63 miles
Direction: N-S
Address range: 326 to 765
Direction: N-S
Address range: 326 to 765
Iowa Ave
Length: 0.52 miles
Direction: N-S
Address range: 328 to 737
Direction: N-S
Address range: 328 to 737
N Ardmore Ave
Length: 0.47 miles
Direction: N-S
Address range: 392 to 699
Direction: N-S
Address range: 392 to 699
W Stone Rd
Length: 0.46 miles
Directions: E-W, SE-NW
Address range: 200 to 498
Directions: E-W, SE-NW
Address range: 200 to 498
N Yale Ave
Length: 0.46 miles
Direction: N-S
Address range: 322 to 675
Direction: N-S
Address range: 322 to 675
N Harvard Ave
Length: 0.45 miles
Direction: N-S
Address range: 322 to 657
Direction: N-S
Address range: 322 to 657
E Sunset Dr
Length: 0.44 miles
Directions: E-W, N-S, SE-NW
Address range: 1 to 219
Directions: E-W, N-S, SE-NW
Address range: 1 to 219
N Wisconsin Ave
Length: 0.42 miles
Direction: N-S
Address range: 422 to 749
Direction: N-S
Address range: 422 to 749
N Princeton Ave
Length: 0.42 miles
Direction: N-S
Address range: 328 to 670
Direction: N-S
Address range: 328 to 670
N Michigan Ave
Length: 0.39 miles
Directions: E-W, N-S
Address range: 400 to 739
Directions: E-W, N-S
Address range: 400 to 739
W Merle St
Length: 0.30 miles
Directions: E-W, SW-NE
Address range: 600 to 799
Directions: E-W, SW-NE
Address range: 600 to 799
James St
Length: 0.29 miles
Directions: E-W, SW-NE
Address range: 594 to 738
Directions: E-W, SW-NE
Address range: 594 to 738
Plymouth St
Length: 0.29 miles
Directions: E-W, SW-NE
Address range: 598 to 743
Directions: E-W, SW-NE
Address range: 598 to 743
Beverly Ave
Length: 0.29 miles
Direction: N-S
Address range: 390 to 528
Direction: N-S
Address range: 390 to 528
W Pleasant Ave
Length: 0.29 miles
Direction: E-W
Address range: 600 to 731
Direction: E-W
Address range: 600 to 731
Chatham Ave
Length: 0.28 miles
Direction: N-S
Address range: 390 to 531
Direction: N-S
Address range: 390 to 531
Douglas Ave
Length: 0.28 miles
Direction: N-S
Address range: 390 to 535
Direction: N-S
Address range: 390 to 535
E Terrace St
Length: 0.27 miles
Direction: E-W
Address range: 1 to 126
Direction: E-W
Address range: 1 to 126
Fulton Ave
Length: 0.25 miles
Direction: N-S
Address range: 392 to 536
Direction: N-S
Address range: 392 to 536
N Ellsworth Ave
Length: 0.25 miles
Direction: N-S
Address range: 400 to 599
Direction: N-S
Address range: 400 to 599
Mission Ave
Length: 0.21 miles
Directions: N-S, SW-NE
Address range: 300 to 399
Directions: N-S, SW-NE
Address range: 300 to 399
Villa Ave (N Villa Ave)
Length: 0.17 miles
Direction: N-S
Address range: 400 to 503
Direction: N-S
Address range: 400 to 503
W Division St
Length: 0.17 miles
Direction: E-W
Address range: 478 to 555
Direction: E-W
Address range: 478 to 555
S Westwood Ave
Length: 0.16 miles
Direction: N-S
Address range: 1100 to 1199
Direction: N-S
Address range: 1100 to 1199
N Gerard Ave
Length: 0.16 miles
Direction: N-S
Address range: 392 to 460
Direction: N-S
Address range: 392 to 460
Roy Dr
Length: 0.15 miles
Directions: E-W, SE-NW
Address range: 680 to 743
Directions: E-W, SE-NW
Address range: 680 to 743
Hamilton Ave
Length: 0.14 miles
Direction: N-S
Address range: 400 to 499
Direction: N-S
Address range: 400 to 499
Westmore Ave
Length: 0.09 miles
Direction: N-S
Direction: N-S
N Hugo Ct
Length: 0.06 miles
Direction: SE-NW
Address range: 400 to 499
Direction: SE-NW
Address range: 400 to 499
Yale Ave
Length: 0.03 miles
Direction: N-S
Direction: N-S
Railroad features:
Length: 6.45 miles
Direction: E-W
Direction: E-W
Illinois Central RR
Length: 2.35 miles
Directions: E-W, SE-NW
Directions: E-W, SE-NW
Chicago and North Western RR
Length: 2.11 miles
Direction: E-W
Direction: E-W
Canadian National Illinois Central
Length: 0.31 miles
Directions: E-W, SE-NW
Directions: E-W, SE-NW
Chicago and Northwestern RR
Length: 0.02 miles
Direction: E-W
Direction: E-W