International Cultural District neighborhood in Artesia, California (CA), 90701, 90703 detailed profile
Settings
X


Business Search - 14 Million verified businesses
Area: 0.327 square miles
Population: 3,902
Population density:
| International Cultural District: | 11,941 people per square mile |
| Artesia: | 10,038 people per square mile |

- 1,47935.6%Asian
- 1,40833.9%Hispanic or Latino
- 65615.8%White
- 47411.4%Black
- 691.7%Two or more races
- 521.3%Native Hawaiian and Other
Pacific Islander - 190.5%Some other race

Median household income in 2022:
| International Cultural District: | $118,717 |
| Artesia: | $92,702 |
Distribution of median household income
![Distribution of median household income]()
- 87Less than $10,000
- 49$10,000 to $19,999
- 77$20,000 to $29,999
- 84$30,000 to $39,999
- 236$40,000 to $49,999
- 98$50,000 to $59,999
- 85$60,000 to $74,999
- 77$75,000 to $99,999
- 128$100,000 to $124,999
- 140$125,000 to $149,999
- 154$150,000 to $199,999
- 236$200,000 or more

Distribution of owner-occupied house/condo value
![Distribution of owner-occupied house/condo value]()
- 38Less than $50,000
- 47$50,000 to $99,999
- 55$100,000 to $149,999
- 48$150,000 to $199,999
- 33$200,000 to $249,999
- 51$250,000 to $299,999
- 26$300,000 to $399,999
- 26$400,000 to $499,999
- 392$500,000 to $749,999
- 367$750,000 to $999,999
- 90$1,000,000 or more

Distribution of rent paid by renters
![Distribution of rent paid by renters]()
- 11$400 to $499
- 21$500 to $599
- 48$600 to $699
- 61$700 to $799
- 17$800 to $899
- 45$900 to $999
- 84$1,000 to $1,249
- 83$1,250 to $1,499
- 121$1,500 to $1,999
- 375$2,000 or more

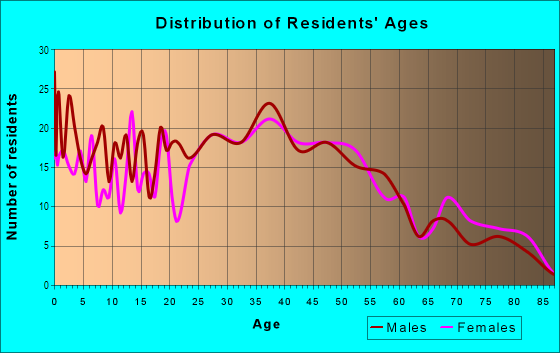
| Males: | 1,901 |
| Females: | 2,001 |
Males:
| This neighborhood: | 48.6 years |
| Whole city: | 38.5 years |
| This neighborhood: | 52.9 years |
| Whole city: | 40.2 years |
Average household size:
| International Cultural District: | 4.1 people |
| Artesia: | 3.5 people |
Percentage of family households:
| International Cultural District: | 58.6% |
| Artesia: | 55.3% |
| Here: | 67.5% |
| Artesia: | 59.3% |
Percentage of married-couple families with children (among all households):
| International Cultural District: | 22.5% |
| Artesia: | 23.4% |
Percentage of single-mother households (among all households):
| International Cultural District: | 6.3% |
| Artesia: | 3.6% |
Percentage of never married males 15 years old and over:
Percentage of never married females 15 years old and over:
| International Cultural District: | 13.1% |
| Artesia: | 17.4% |
Percentage of never married females 15 years old and over:
| International Cultural District: | 18.2% |
| city: | 18.3% |
Percentage of people that speak English not well or not at all:
| International Cultural District: | 8.8% |
| Artesia: | 11.0% |
Percentage of people born in this state:
Percentage of people born in another U.S. state:
Percentage of native residents but born outside the U.S.:
Percentage of foreign born residents:
| Here: | 49.5% |
| Artesia: | 44.9% |
Percentage of people born in another U.S. state:
| International Cultural District: | 5.1% |
| Artesia: | 5.2% |
Percentage of native residents but born outside the U.S.:
| Here: | 1.7% |
| city: | 1.4% |
Percentage of foreign born residents:
| Here: | 43.7% |
| Artesia: | 48.5% |

Owner-occupied
Renter-occupied


- Rooms in owner-occupied houses and condos in International Cultural District
- 221 room
- 202 rooms
- 93 rooms
- 474 rooms
- 1355 rooms
- 2706 rooms
- 1727 rooms
- 1508 rooms
- 1409+ rooms

- Rooms in renter-occupied apartments in International Cultural District
- 571 room
- 642 rooms
- 803 rooms
- 1174 rooms
- 1205 rooms
- 606 rooms
- 607 rooms
- 768 rooms
- 259+ rooms
Owner-occupied
Renter-occupied

- Bedrooms in owner-occupied houses and condos in International Cultural District
- 4no bedroom
- 381 bedroom
- 902 bedrooms
- 1743 bedrooms
- 5284 bedrooms
- 1415+ bedrooms

- Bedrooms in renter-occupied apartments in International Cultural District
- 57no bedroom
- 1201 bedroom
- 1422 bedrooms
- 963 bedrooms
- 1064 bedrooms
- 145+ bedrooms
Average number of cars or other vehicles available in houses/condos:
Average number of cars or other vehicles available in apartments:
| This neighborhood: | 2.4 |
| Artesia: | 2.6 |
Average number of cars or other vehicles available in apartments:
| Here: | 2.2 |
| city: | 2.2 |
Percentage of units with a mortgage:
| International Cultural District: | 53.0% |
| Artesia: | 67.6% |
Average estimated value of detached houses in 2022 (74.5% of all units):
| International Cultural District: | $833,903 |
| California: | $988,808 |

- Year house built in International Cultural District
- 02020 or later
- 522010 to 2019
- 972000 to 2009
- 1101990 to 1999
- 731980 to 1989
- 2771970 to 1979
- 4361960 to 1969
- 3081950 to 1959
- 1071940 to 1949
- 1481939 or earlier

City-data.com crime index for city in 2020 (higher means more crime):
| City: | 229.3 |
| U.S. average: | 219.5 |
Travel time to work (commute)
![Travel time to work (commute)]()
- 13Less than 5 minutes
- 1055 to 9 minutes
- 32010 to 14 minutes
- 33115 to 19 minutes
- 22320 to 24 minutes
- 3625 to 29 minutes
- 19730 to 34 minutes
- 6635 to 39 minutes
- 9440 to 44 minutes
- 15045 to 59 minutes
- 14560 to 89 minutes
- 8290 or more minutes

Means of transportation to work
![Means of transportation to work]()
- 76.7%1,165Drove a car alone
- 9.3%142Carpooled
- 1.3%20Bus
- 0.7%10Subway or elevated rail
- 1.9%29Light rail, streetcar or trolley
- 0.9%13Taxi
- 14.3%217Bicycle
- 44.8%680Walked
- 1.2%18Other means
- 9.8%149Worked at home

Time leaving home to go to work
![Time leaving home to go to work]()
- 6512:00 a.m. to 4:59 a.m.
- 1045:00 a.m. to 5:29 a.m.
- 1085:30 a.m. to 5:59 a.m.
- 1296:00 a.m. to 6:29 a.m.
- 1316:30 a.m. to 6:59 a.m.
- 2607:00 a.m. to 7:29 a.m.
- 2257:30 a.m. to 7:59 a.m.
- 1718:00 a.m. to 8:29 a.m.
- 948:30 a.m. to 8:59 a.m.
- 1169:00 a.m. to 9:59 a.m.
- 2610:00 a.m. to 10:59 a.m.
- 2411:00 a.m. to 11:59 a.m.
- 23912:00 p.m. to 3:59 p.m.
- 1284:00 p.m. to 11:59 p.m.

Occupations of males:
- Percentage of males in management occupations (except farmers):
Here: 9.7% city: 12.0%
- Percentage of males in business and financial operations occupations:
Here: 1.9% city: 3.7%
- Percentage of males in computer and mathematical occupations:
Here: 5.3% city: 5.3%
- Percentage of males in architecture and engineering occupations:
Here: 6.7% city: 2.3%
- Percentage of males in healthcare practitioners and technical occupations:
Here: 1.9% city: 7.4%
- Percentage of males in service occupations:
Here: 21.3% city: 18.2%
- Percentage of males in sales and office occupations:
Here: 29.6% city: 14.1%
- Percentage of males in construction, extraction, and maintenance occupations:
Here: 5.7% city: 6.6%
- Percentage of males in production occupations:
Here: 6.4% city: 8.4%
- Percentage of males in transportation occupations:
Here: 5.2% city: 5.8%
- Percentage of males in material moving occupations:
Here: 2.2% city: 5.1%
Occupations of females:
- Percentage of females in management occupations (except farmers):
Here: 12.6% city: 11.7%
- Percentage of females in business and financial operations occupations:
Here: 3.3% city: 8.2%
- Percentage of females in architecture and engineering occupations:
Here: 1.2% city: 1.7%
- Percentage of females in life, physical, and social science occupations:
Here: 1.9% city: 0.3%
- Percentage of females in legal occupations:
Here: 2.3% city: 1.5%
- Percentage of females in education, training, and library occupations:
Here: 6.3% city: 7.1%
- Percentage of females in arts, design, entertainment, sports, and media occupations:
Here: 2.5% city: 0.4%
- Percentage of females in healthcare practitioners and technical occupations:
Here: 12.2% city: 10.3%
- Percentage of females in service occupations:
Here: 20.0% city: 22.5%
- Percentage of females in sales and office occupations:
Here: 30.1% city: 28.4%
- Percentage of females in material moving occupations:
Here: 6.0% city: 4.8%
Percentage of people 16-64 in Armed Forces:
| International Cultural District: | 0.3% |
| Artesia: | 0.2% |
Education in this neighborhood (subdivision or community):
- Percentage of people 3 years and older in K-12 schools:
International Cultural District: 20.6% Artesia: 15.0%
- Percentage of people 3 years and older in undergraduate colleges:
International Cultural District: 5.6% Artesia: 7.8%
- Percentage of people 3 years and older in grad. or professional schools:
International Cultural District: 6.0% Artesia: 2.2%
- Percentage of students K-12 enrolled in private schools:
International Cultural District: 34.5% Artesia: 3.6%
Percentage of population below poverty level:
| International Cultural District: | 6.6% |
| Artesia: | 7.3% |
Median year owner moved in (as recorded in 2022):
Median year renter moved in (as recorded in 2022):
| International Cultural District: | 2324 |
| Artesia: | 2001 |
Median year renter moved in (as recorded in 2022):
| International Cultural District: | 2338 |
| Artesia: | 2012 |
Percentage of married-couple families with both working:
| International Cultural District: | 70.3% |
| Artesia: | 63.8% |

- 61.1%Utility gas
- 23.0%Electricity
- 8.9%No fuel used
- 4.7%Solar energy
- 2.4%Bottled, tank, or LP gas
Highways in this neighborhood:
Roads and streets:
Pioneer Blvd
Length: 1.40 miles
Directions: N-S, SW-NE
Address range: 17000 to 19249
Directions: N-S, SW-NE
Address range: 17000 to 19249
Arline Ave
Length: 0.62 miles
Direction: N-S
Address range: 17900 to 18899
Direction: N-S
Address range: 17900 to 18899
Corby Ave
Length: 0.55 miles
Directions: N-S, SE-NW
Address range: 17200 to 18899
Directions: N-S, SE-NW
Address range: 17200 to 18899
187th St
Length: 0.19 miles
Direction: E-W
Address range: 11726 to 11828
Direction: E-W
Address range: 11726 to 11828
South St
Length: 0.17 miles
Direction: E-W
Address range: 11751 to 11837
Direction: E-W
Address range: 11751 to 11837
186th St
Length: 0.17 miles
Direction: E-W
Address range: 11736 to 11832
Direction: E-W
Address range: 11736 to 11832
Artesia Blvd
Length: 0.12 miles
Direction: E-W
Address range: 11621 to 11799
Direction: E-W
Address range: 11621 to 11799
Ashworth St
Length: 0.09 miles
Direction: E-W
Address range: 11800 to 11842
Direction: E-W
Address range: 11800 to 11842
183rd St
Length: 0.09 miles
Direction: E-W
Address range: 11800 to 11832
Direction: E-W
Address range: 11800 to 11832
188th St
Length: 0.08 miles
Direction: E-W
Address range: 11728 to 11799
Direction: E-W
Address range: 11728 to 11799
Poseidon Ave
Length: 0.06 miles
Direction: N-S
Address range: 19100 to 19224
Direction: N-S
Address range: 19100 to 19224
Degas Pl
Length: 0.03 miles
Direction: E-W
Address range: 11800 to 11899
Direction: E-W
Address range: 11800 to 11899
Railroad features:
Pacific Electric Rlwy
Length: 0.21 miles
Direction: SE-NW
Direction: SE-NW