Ingold-Milldale neighborhood in Burlingame, California (CA), 94010, 94030 detailed profile
Settings
X


Business Search - 14 Million verified businesses
Area: 0.804 square miles
Population: 1,692
Population density:
| Ingold-Milldale: | 2,103 people per square mile |
| Burlingame: | 7,151 people per square mile |

- 89145.8%White
- 32116.5%Asian
- 30315.6%Hispanic or Latino
- 24612.6%Native Hawaiian and Other
Pacific Islander - 844.3%Black
- 522.7%Two or more races
- 482.5%Some other race

Distribution of median household income
![Distribution of median household income]()
- 18Less than $10,000
- 89$10,000 to $19,999
- 104$20,000 to $29,999
- 14$30,000 to $39,999
- 65$40,000 to $49,999
- 25$50,000 to $59,999
- 34$60,000 to $74,999
- 52$75,000 to $99,999
- 75$100,000 to $124,999
- 26$125,000 to $149,999
- 133$150,000 to $199,999
- 231$200,000 or more

Distribution of owner-occupied house/condo value
![Distribution of owner-occupied house/condo value]()
- 4Less than $50,000
- 10$100,000 to $149,999
- 8$150,000 to $199,999
- 22$200,000 to $249,999
- 20$300,000 to $399,999
- 4$500,000 to $749,999
- 20$750,000 to $999,999
- 283$1,000,000 or more

Distribution of rent paid by renters
![Distribution of rent paid by renters]()
- 56$100 to $199
- 25$300 to $399
- 7$1,000 to $1,249
- 20$1,250 to $1,499
- 93$1,500 to $1,999
- 290$2,000 or more

Median rent in 2022:
| Ingold-Milldale: | $2,491 |
| Burlingame: | $2,001 |
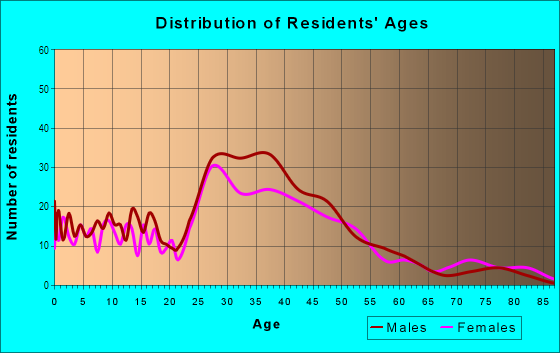
| Males: | 910 |
| Females: | 782 |
Males:
| This neighborhood: | 39.3 years |
| Whole city: | 39.7 years |
| This neighborhood: | 39.1 years |
| Whole city: | 41.7 years |
Average household size:
| Ingold-Milldale: | 6.7 people |
| Burlingame: | 2.5 people |
Percentage of family households:
| Ingold-Milldale: | 45.8% |
| Burlingame: | 45.6% |
| Here: | 52.8% |
| Burlingame: | 51.2% |
Percentage of married-couple families with children (among all households):
| Ingold-Milldale: | 36.1% |
| Burlingame: | 34.1% |
Percentage of single-mother households (among all households):
| Ingold-Milldale: | 3.3% |
| Burlingame: | 3.6% |
Percentage of never married males 15 years old and over:
Percentage of never married females 15 years old and over:
| Ingold-Milldale: | 21.7% |
| Burlingame: | 18.3% |
Percentage of never married females 15 years old and over:
| Ingold-Milldale: | 11.8% |
| city: | 13.4% |
Percentage of people that speak English not well or not at all:
| Ingold-Milldale: | 3.5% |
| Burlingame: | 4.7% |
Percentage of people born in this state:
Percentage of people born in another U.S. state:
Percentage of native residents but born outside the U.S.:
Percentage of foreign born residents:
| Here: | 52.4% |
| Burlingame: | 52.5% |
Percentage of people born in another U.S. state:
| Ingold-Milldale: | 13.2% |
| Burlingame: | 16.0% |
Percentage of native residents but born outside the U.S.:
| Here: | 1.5% |
| city: | 1.6% |
Percentage of foreign born residents:
| Here: | 32.9% |
| Burlingame: | 30.0% |

Owner-occupied
Renter-occupied


- Rooms in owner-occupied houses and condos in Ingold-Milldale
- 31 room
- 512 rooms
- 113 rooms
- 234 rooms
- 1075 rooms
- 526 rooms
- 837 rooms
- 428 rooms
- 1589+ rooms

- Rooms in renter-occupied apartments in Ingold-Milldale
- 751 room
- 522 rooms
- 953 rooms
- 894 rooms
- 695 rooms
- 246 rooms
- 77 rooms
- 928 rooms
- 839+ rooms
Owner-occupied
Renter-occupied

- Bedrooms in owner-occupied houses and condos in Ingold-Milldale
- 3no bedroom
- 511 bedroom
- 792 bedrooms
- 1223 bedrooms
- 494 bedrooms
- 635+ bedrooms

- Bedrooms in renter-occupied apartments in Ingold-Milldale
- 83no bedroom
- 1551 bedroom
- 1282 bedrooms
- 473 bedrooms
- 774 bedrooms
- 1455+ bedrooms
Average number of cars or other vehicles available in houses/condos:
Average number of cars or other vehicles available in apartments:
| This neighborhood: | 2.3 |
| Burlingame: | 2.2 |
Average number of cars or other vehicles available in apartments:
| Here: | 1.6 |
| city: | 1.4 |
Percentage of units with a mortgage:
| Ingold-Milldale: | 74.9% |
| Burlingame: | 71.7% |

- Year house built in Ingold-Milldale
- 542020 or later
- 462010 to 2019
- 372000 to 2009
- 111990 to 1999
- 231980 to 1989
- 831970 to 1979
- 881960 to 1969
- 1431950 to 1959
- 961940 to 1949
- 2131939 or earlier

City-data.com crime index for city in 2020 (higher means more crime):
| City: | 236.7 |
| U.S. average: | 219.5 |
Travel time to work (commute)
![Travel time to work (commute)]()
- 19Less than 5 minutes
- 585 to 9 minutes
- 10610 to 14 minutes
- 9815 to 19 minutes
- 9620 to 24 minutes
- 3325 to 29 minutes
- 11030 to 34 minutes
- 2535 to 39 minutes
- 4240 to 44 minutes
- 9745 to 59 minutes
- 11960 to 89 minutes
- 3890 or more minutes

Means of transportation to work
![Means of transportation to work]()
- 57.4%532Drove a car alone
- 6.7%62Carpooled
- 7.5%70Bus
- 5.6%52Subway or elevated rail
- 4.4%41Long-distance train or commuter rail
- 0.4%4Light rail, streetcar or trolley
- 9.6%89Taxi
- 0.9%8Motorcycle
- 0.9%8Bicycle
- 4.0%37Walked
- 4.5%42Other means
- 18.4%171Worked at home

Time leaving home to go to work
![Time leaving home to go to work]()
- 7012:00 a.m. to 4:59 a.m.
- 265:00 a.m. to 5:29 a.m.
- 175:30 a.m. to 5:59 a.m.
- 746:00 a.m. to 6:29 a.m.
- 606:30 a.m. to 6:59 a.m.
- 777:00 a.m. to 7:29 a.m.
- 917:30 a.m. to 7:59 a.m.
- 998:00 a.m. to 8:29 a.m.
- 678:30 a.m. to 8:59 a.m.
- 1059:00 a.m. to 9:59 a.m.
- 3710:00 a.m. to 10:59 a.m.
- 3311:00 a.m. to 11:59 a.m.
- 5412:00 p.m. to 3:59 p.m.
- 434:00 p.m. to 11:59 p.m.

Occupations of males:
- Percentage of males in management occupations (except farmers):
Here: 15.3% city: 21.1%
- Percentage of males in business and financial operations occupations:
Here: 11.4% city: 8.6%
- Percentage of males in computer and mathematical occupations:
Here: 7.4% city: 7.1%
- Percentage of males in architecture and engineering occupations:
Here: 3.7% city: 4.9%
- Percentage of males in life, physical, and social science occupations:
Here: 2.3% city: 3.3%
- Percentage of males in community and social services occupations:
Here: 3.4% city: 1.3%
- Percentage of males in legal occupations:
Here: 3.6% city: 3.3%
- Percentage of males in education, training, and library occupations:
Here: 1.3% city: 3.4%
- Percentage of males in arts, design, entertainment, sports, and media occupations:
Here: 5.4% city: 2.6%
- Percentage of males in healthcare practitioners and technical occupations:
Here: 2.5% city: 3.1%
- Percentage of males in service occupations:
Here: 13.1% city: 12.7%
- Percentage of males in sales and office occupations:
Here: 13.8% city: 12.6%
- Percentage of males in construction, extraction, and maintenance occupations:
Here: 3.1% city: 6.1%
- Percentage of males in production occupations:
Here: 4.0% city: 1.8%
- Percentage of males in transportation occupations:
Here: 7.2% city: 3.9%
- Percentage of males in material moving occupations:
Here: 1.3% city: 3.4%
Occupations of females:
- Percentage of females in management occupations (except farmers):
Here: 12.7% city: 20.8%
- Percentage of females in business and financial operations occupations:
Here: 8.9% city: 10.1%
- Percentage of females in computer and mathematical occupations:
Here: 2.7% city: 4.3%
- Percentage of females in architecture and engineering occupations:
Here: 2.5% city: 2.4%
- Percentage of females in life, physical, and social science occupations:
Here: 8.6% city: 4.3%
- Percentage of females in legal occupations:
Here: 1.3% city: 3.4%
- Percentage of females in education, training, and library occupations:
Here: 5.6% city: 7.2%
- Percentage of females in arts, design, entertainment, sports, and media occupations:
Here: 3.9% city: 2.1%
- Percentage of females in healthcare practitioners and technical occupations:
Here: 7.9% city: 10.3%
- Percentage of females in service occupations:
Here: 12.6% city: 11.2%
- Percentage of females in sales and office occupations:
Here: 27.9% city: 19.2%
- Percentage of females in transportation occupations:
Here: 3.5% city: 1.8%
- Percentage of females in material moving occupations:
Here: 1.3% city: 0.9%
Education in this neighborhood (subdivision or community):
- Percentage of people 3 years and older in K-12 schools:
Ingold-Milldale: 28.9% Burlingame: 17.3%
- Percentage of people 3 years and older in undergraduate colleges:
Ingold-Milldale: 5.3% Burlingame: 4.6%
- Percentage of people 3 years and older in grad. or professional schools:
Ingold-Milldale: 8.1% Burlingame: 1.3%
- Percentage of students K-12 enrolled in private schools:
Ingold-Milldale: 117.6% Burlingame: 20.4%
Percentage of population below poverty level:
| Ingold-Milldale: | 4.8% |
| Burlingame: | 5.0% |
Median year owner moved in (as recorded in 2022):
| Ingold-Milldale: | 2002 |
| Burlingame: | 2002 |
Percentage of married-couple families with both working:
| Ingold-Milldale: | 80.6% |
| Burlingame: | 75.6% |

- 56.0%Utility gas
- 33.1%Electricity
- 4.4%Bottled, tank, or LP gas
- 3.7%No fuel used
- 1.6%Solar energy
- 1.2%Other fuel
Limited-access highways (interstate or state) in this neighborhood:
Bayshore Fwy (US Hwy 101)
Length: 2.17 miles
Directions: E-W, SE-NW
Directions: E-W, SE-NW
Roads and streets:
Rollins Rd
Length: 2.88 miles
Directions: E-W, SE-NW
Address range: 1 to 1899
Directions: E-W, SE-NW
Address range: 1 to 1899
US Hwy 101
Length: 2.87 miles
Directions: E-W, N-S, SE-NW, SW-NE
Directions: E-W, N-S, SE-NW, SW-NE
Adrian Rd
Length: 1.25 miles
Directions: E-W, SE-NW, SW-NE
Address range: 200 to 1799
Directions: E-W, SE-NW, SW-NE
Address range: 200 to 1799
Carolan Ave
Length: 0.94 miles
Directions: E-W, SE-NW
Address range: 700 to 1199
Directions: E-W, SE-NW
Address range: 700 to 1199
Linden Ave
Length: 0.53 miles
Directions: E-W, SE-NW
Address range: 700 to 999
Directions: E-W, SE-NW
Address range: 700 to 999
Oak Grove Ave
Length: 0.50 miles
Direction: SW-NE
Address range: 500 to 1099
Direction: SW-NE
Address range: 500 to 1099
California Dr
Length: 0.49 miles
Directions: E-W, SE-NW
Address range: 1000 to 1300
Directions: E-W, SE-NW
Address range: 1000 to 1300
N Carolan Ave
Length: 0.37 miles
Direction: SE-NW
Address range: 1300 to 1499
Direction: SE-NW
Address range: 1300 to 1499
Gilbreth Rd
Length: 0.37 miles
Directions: E-W, SE-NW
Address range: 1500 to 1719
Directions: E-W, SE-NW
Address range: 1500 to 1719
Laurel Ave
Length: 0.32 miles
Direction: SE-NW
Address range: 700 to 899
Direction: SE-NW
Address range: 700 to 899
Marsten Rd
Length: 0.31 miles
Directions: N-S, SE-NW, SW-NE
Address range: 1200 to 1499
Directions: N-S, SE-NW, SW-NE
Address range: 1200 to 1499
Morrell Ave
Length: 0.30 miles
Directions: N-S, SW-NE
Address range: 773 to 1099
Directions: N-S, SW-NE
Address range: 773 to 1099
E Millbrae Ave
Length: 0.30 miles
Direction: SW-NE
Address range: 100 to 379
Direction: SW-NE
Address range: 100 to 379
Park Ave
Length: 0.28 miles
Directions: E-W, SW-NE
Address range: 700 to 1099
Directions: E-W, SW-NE
Address range: 700 to 1099
Winchester Dr
Length: 0.25 miles
Directions: N-S, SE-NW
Address range: 700 to 899
Directions: N-S, SE-NW
Address range: 700 to 899
Larkspur Dr
Length: 0.24 miles
Directions: N-S, SW-NE
Address range: 900 to 1099
Directions: N-S, SW-NE
Address range: 900 to 1099
Broadway
Length: 0.24 miles
Directions: E-W, N-S, SW-NE
Address range: 900 to 1099
Directions: E-W, N-S, SW-NE
Address range: 900 to 1099
Nerli Ln
Length: 0.18 miles
Directions: N-S, SE-NW, SW-NE
Directions: N-S, SE-NW, SW-NE
Cadillac Way
Length: 0.16 miles
Directions: N-S, SE-NW, SW-NE
Address range: 900 to 1099
Directions: N-S, SE-NW, SW-NE
Address range: 900 to 1099
David Rd
Length: 0.15 miles
Direction: SW-NE
Address range: 900 to 999
Direction: SW-NE
Address range: 900 to 999
Toyon Dr
Length: 0.15 miles
Directions: N-S, SW-NE
Address range: 900 to 1099
Directions: N-S, SW-NE
Address range: 900 to 1099
Broderick Rd
Length: 0.14 miles
Direction: SW-NE
Address range: 1 to 99
Direction: SW-NE
Address range: 1 to 99
Francisco Dr
Length: 0.14 miles
Direction: N-S
Address range: 500 to 599
Direction: N-S
Address range: 500 to 599
Guittard Rd
Length: 0.13 miles
Direction: SW-NE
Address range: 1 to 99
Direction: SW-NE
Address range: 1 to 99
Maple Ave
Length: 0.12 miles
Direction: SE-NW
Address range: 800 to 899
Direction: SE-NW
Address range: 800 to 899
Alpine Ave
Length: 0.12 miles
Directions: N-S, SE-NW
Address range: 800 to 899
Directions: N-S, SE-NW
Address range: 800 to 899
Corbitt Dr
Length: 0.12 miles
Direction: N-S
Address range: 500 to 599
Direction: N-S
Address range: 500 to 599
Anza Blvd
Length: 0.12 miles
Directions: E-W, SW-NE
Directions: E-W, SW-NE
Azalea Ave
Length: 0.11 miles
Direction: SE-NW
Address range: 900 to 999
Direction: SE-NW
Address range: 900 to 999
Adrian Ct
Length: 0.11 miles
Direction: SW-NE
Address range: 1 to 99
Direction: SW-NE
Address range: 1 to 99
Ingold Rd
Length: 0.10 miles
Direction: SW-NE
Address range: 1 to 99
Direction: SW-NE
Address range: 1 to 99
Edwards Ct
Length: 0.08 miles
Direction: SW-NE
Address range: 1 to 99
Direction: SW-NE
Address range: 1 to 99
Marin Dr
Length: 0.08 miles
Direction: N-S
Address range: 500 to 599
Direction: N-S
Address range: 500 to 599
Whitehorn Way
Length: 0.08 miles
Directions: E-W, SE-NW
Address range: 1228 to 1299
Directions: E-W, SE-NW
Address range: 1228 to 1299
Edwards Rd
Length: 0.06 miles
Direction: SW-NE
Address range: 1000 to 1099
Direction: SW-NE
Address range: 1000 to 1099
Whitehorn Rd
Length: 0.06 miles
Directions: E-W, SE-NW, SW-NE
Address range: 1200 to 1227
Directions: E-W, SE-NW, SW-NE
Address range: 1200 to 1227
Star Way
Length: 0.05 miles
Direction: SW-NE
Address range: 1 to 199
Direction: SW-NE
Address range: 1 to 199
Winchester Pl
Length: 0.04 miles
Direction: N-S
Address range: 1 to 99
Direction: N-S
Address range: 1 to 99
Rose Ct
Length: 0.04 miles
Direction: N-S
Address range: 900 to 999
Direction: N-S
Address range: 900 to 999
Railroad features:
Union Pacific RR
Length: 2.72 miles
Direction: SE-NW
Direction: SE-NW
Caltrain
Length: 1.26 miles
Directions: E-W, SE-NW
Directions: E-W, SE-NW
Freight
Length: 0.25 miles
Directions: E-W, SE-NW
Directions: E-W, SE-NW
Other features:
Sanchez Crk
Length: 0.19 miles
Direction: SW-NE
Direction: SW-NE
Stream
Length: 0.12 miles
Directions: SE-NW, SW-NE
Directions: SE-NW, SW-NE