Honeytown (Honey Town) neighborhood in Wooster, Ohio (OH), 44691 detailed profile
Settings
X


Business Search - 14 Million verified businesses
Area: 3.445 square miles
Population: 566
Population density:
| Honeytown (Honey Town): | 164 people per square mile |
| Wooster: | 1,880 people per square mile |

- 55068.3%White
- 18923.5%Hispanic or Latino
- 506.2%Black
- 141.7%Two or more races
- 20.2%Asian

Median household income in 2022:
| Honeytown (Honey Town): | $59,521 |
| Wooster: | $61,608 |
Distribution of median household income
![Distribution of median household income]()
- 8Less than $10,000
- 94$10,000 to $19,999
- 27$20,000 to $29,999
- 16$30,000 to $39,999
- 46$40,000 to $49,999
- 31$50,000 to $59,999
- 34$60,000 to $74,999
- 37$75,000 to $99,999
- 23$100,000 to $124,999
- 3$125,000 to $149,999
- 20$150,000 to $199,999
- 7$200,000 or more

Distribution of owner-occupied house/condo value
![Distribution of owner-occupied house/condo value]()
- 23Less than $50,000
- 317$50,000 to $99,999
- 19$100,000 to $149,999
- 40$150,000 to $199,999
- 13$200,000 to $249,999
- 40$250,000 to $299,999
- 12$300,000 to $399,999
- 6$400,000 to $499,999
- 19$500,000 to $749,999
- 2$750,000 to $999,999

Distribution of rent paid by renters
![Distribution of rent paid by renters]()
- 2$100 to $199
- 12$200 to $299
- 17$300 to $399
- 26$400 to $499
- 6$500 to $599
- 16$600 to $699
- 43$700 to $799
- 83$800 to $899
- 3$1,000 to $1,249
- 62$1,250 to $1,499
- 7$2,000 or more

Median rent in 2022:
| Honeytown (Honey Town): | $621 |
| Wooster: | $701 |
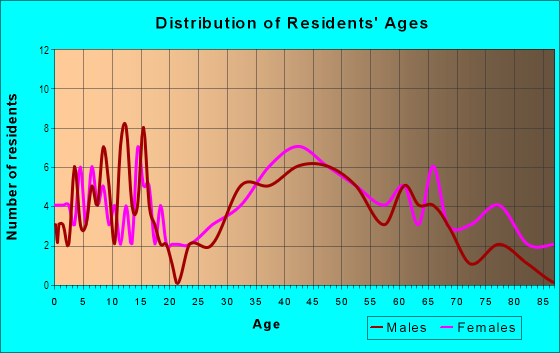
| Males: | 288 |
| Females: | 278 |
Males:
| This neighborhood: | 29.3 years |
| Whole city: | 39.6 years |
| This neighborhood: | 34.6 years |
| Whole city: | 38.3 years |
Average household size:
| Honeytown (Honey Town): | 2.7 people |
| Wooster: | 2.2 people |
Percentage of family households:
| Honeytown (Honey Town): | 53.1% |
| Wooster: | 40.4% |
| Here: | 62.5% |
| Wooster: | 42.8% |
Percentage of married-couple families with children (among all households):
| Honeytown (Honey Town): | 30.3% |
| Wooster: | 27.6% |
Percentage of single-mother households (among all households):
| Honeytown (Honey Town): | 6.8% |
| Wooster: | 8.4% |
Percentage of never married males 15 years old and over:
Percentage of never married females 15 years old and over:
| Honeytown (Honey Town): | 11.5% |
| Wooster: | 18.0% |
Percentage of never married females 15 years old and over:
| Honeytown (Honey Town): | 12.4% |
| city: | 19.7% |
Percentage of people that speak English not well or not at all:
| Honeytown (Honey Town): | 1.1% |
| Wooster: | 0.2% |
Percentage of people born in this state:
Percentage of people born in another U.S. state:
Percentage of native residents but born outside the U.S.:
Percentage of foreign born residents:
| Here: | 82.3% |
| Wooster: | 72.1% |
Percentage of people born in another U.S. state:
| Honeytown (Honey Town): | 15.9% |
| Wooster: | 22.5% |
Percentage of native residents but born outside the U.S.:
| Here: | 3.0% |
| city: | 0.6% |
Percentage of foreign born residents:
| Here: | 2.7% |
| Wooster: | 4.8% |

Owner-occupied
Renter-occupied


- Rooms in owner-occupied houses and condos in Honeytown <
> - 01 room
- 02 rooms
- 93 rooms
- 74 rooms
- 385 rooms
- 346 rooms
- 177 rooms
- 398 rooms
- 279+ rooms

- Rooms in renter-occupied apartments in Honeytown <
> - 131 room
- 32 rooms
- 43 rooms
- 144 rooms
- 135 rooms
- 26 rooms
- 57 rooms
- 08 rooms
- 359+ rooms
Owner-occupied
Renter-occupied

- Bedrooms in owner-occupied houses and condos in Honeytown <
> - 0no bedroom
- 11 bedroom
- 392 bedrooms
- 723 bedrooms
- 574 bedrooms
- 55+ bedrooms

- Bedrooms in renter-occupied apartments in Honeytown <
> - 13no bedroom
- 41 bedroom
- 242 bedrooms
- 63 bedrooms
- 14 bedrooms
- 05+ bedrooms
Average number of cars or other vehicles available in houses/condos:
Average number of cars or other vehicles available in apartments:
| This neighborhood: | 1.7 |
| Wooster: | 1.9 |
Average number of cars or other vehicles available in apartments:
| Here: | 1.6 |
| city: | 1.1 |
Percentage of units with a mortgage:
| Honeytown (Honey Town): | 49.9% |
| Wooster: | 58.3% |
Average estimated value of detached houses in 2022 (75.5% of all units):
| Honeytown (Honey Town): | $94,702 |
| Ohio: | $254,366 |

- Year house built in Honeytown <
> - 02020 or later
- 162010 to 2019
- 82000 to 2009
- 481990 to 1999
- 301980 to 1989
- 461970 to 1979
- 471960 to 1969
- 181950 to 1959
- 61940 to 1949
- 41939 or earlier

City-data.com crime index for city in 2020 (higher means more crime):
| City: | 216.1 |
| U.S. average: | 219.5 |
Travel time to work (commute)
![Travel time to work (commute)]()
- 35Less than 5 minutes
- 635 to 9 minutes
- 4310 to 14 minutes
- 2215 to 19 minutes
- 1720 to 24 minutes
- 825 to 29 minutes
- 430 to 34 minutes
- 635 to 39 minutes
- 640 to 44 minutes
- 645 to 59 minutes
- 360 to 89 minutes
- 490 or more minutes

Means of transportation to work
![Means of transportation to work]()
- 60.3%151Drove a car alone
- 8.4%21Carpooled
- 2.8%7Taxi
- 9.6%24Bicycle
- 9.2%23Walked
- 0.4%1Other means
- 8.8%22Worked at home

Time leaving home to go to work
![Time leaving home to go to work]()
- 2312:00 a.m. to 4:59 a.m.
- 145:00 a.m. to 5:29 a.m.
- 285:30 a.m. to 5:59 a.m.
- 156:00 a.m. to 6:29 a.m.
- 266:30 a.m. to 6:59 a.m.
- 257:00 a.m. to 7:29 a.m.
- 57:30 a.m. to 7:59 a.m.
- 98:00 a.m. to 8:29 a.m.
- 78:30 a.m. to 8:59 a.m.
- 119:00 a.m. to 9:59 a.m.
- 810:00 a.m. to 10:59 a.m.
- 1712:00 p.m. to 3:59 p.m.
- 234:00 p.m. to 11:59 p.m.

Occupations of males:
- Percentage of males in management occupations (except farmers):
Here: 17.8% city: 9.9%
- Percentage of males in business and financial operations occupations:
Here: 3.2% city: 5.1%
- Percentage of males in architecture and engineering occupations:
Here: 3.6% city: 3.1%
- Percentage of males in education, training, and library occupations:
Here: 1.4% city: 5.2%
- Percentage of males in arts, design, entertainment, sports, and media occupations:
Here: 1.3% city: 2.2%
- Percentage of males in service occupations:
Here: 4.6% city: 13.2%
- Percentage of males in sales and office occupations:
Here: 6.5% city: 12.1%
- Percentage of males in construction, extraction, and maintenance occupations:
Here: 26.8% city: 2.9%
- Percentage of males in production occupations:
Here: 23.4% city: 12.4%
- Percentage of males in transportation occupations:
Here: 5.4% city: 5.6%
- Percentage of males in material moving occupations:
Here: 7.6% city: 10.2%
Occupations of females:
- Percentage of females in management occupations (except farmers):
Here: 3.8% city: 4.3%
- Percentage of females in business and financial operations occupations:
Here: 4.7% city: 2.3%
- Percentage of females in life, physical, and social science occupations:
Here: 5.5% city: 1.3%
- Percentage of females in community and social services occupations:
Here: 1.1% city: 2.3%
- Percentage of females in education, training, and library occupations:
Here: 7.4% city: 11.3%
- Percentage of females in arts, design, entertainment, sports, and media occupations:
Here: 9.1% city: 2.5%
- Percentage of females in service occupations:
Here: 18.4% city: 20.5%
- Percentage of females in sales and office occupations:
Here: 34.1% city: 25.3%
- Percentage of females in farming, fishing, and forestry occupations:
Here: 6.6% city: 1.1%
- Percentage of females in production occupations:
Here: 25.4% city: 10.4%
- Percentage of females in transportation occupations:
Here: 6.1% city: 0.7%
- Percentage of females in material moving occupations:
Here: 12.1% city: 4.6%
Education in this neighborhood (subdivision or community):
- Percentage of people 3 years and older in K-12 schools:
Honeytown (Honey Town): 37.3% Wooster: 13.5%
- Percentage of people 3 years and older in undergraduate colleges:
Honeytown (Honey Town): 3.2% Wooster: 13.3%
- Percentage of people 3 years and older in grad. or professional schools:
Honeytown (Honey Town): 0.2% Wooster: 0.3%
- Percentage of students K-12 enrolled in private schools:
Honeytown (Honey Town): 14.5% Wooster: 9.3%
Percentage of population below poverty level:
| Honeytown (Honey Town): | 13.7% |
| Wooster: | 10.8% |
Median year owner moved in (as recorded in 2022):
Median year renter moved in (as recorded in 2022):
| Honeytown (Honey Town): | 2009 |
| Wooster: | 2010 |
Median year renter moved in (as recorded in 2022):
| Honeytown (Honey Town): | 2017 |
| Wooster: | 2017 |
Percentage of married-couple families with both working:
| Honeytown (Honey Town): | 23.2% |
| Wooster: | 75.9% |

- 55.6%Utility gas
- 14.9%Wood
- 14.4%Electricity
- 7.1%Bottled, tank, or LP gas
- 4.1%Fuel oil, kerosene, etc.
- 2.3%No fuel used
- 1.5%Other fuel
Highways in this neighborhood:
Lincoln Way (US Rte 30)
Length: 2.20 miles
Direction: E-W
Address range: 4140 to 6473
Direction: E-W
Address range: 4140 to 6473
Roads and streets:
Co Hwy 359 (Secrest Rd)
Length: 2.91 miles
Directions: E-W, N-S, SE-NW
Address range: 3728 to 6599
Directions: E-W, N-S, SE-NW
Address range: 3728 to 6599
Twp Hwy 163 (Ely Rd)
Length: 1.60 miles
Direction: E-W
Address range: 4800 to 6599
Direction: E-W
Address range: 4800 to 6599
Honeytown Rd (S Honeytown Rd, Twp Hwy 54)
Length: 1.35 miles
Directions: E-W, N-S, SW-NE
Address range: 1 to 1199
Directions: E-W, N-S, SW-NE
Address range: 1 to 1199
Chestnut Ridge Dr
Length: 0.66 miles
Direction: E-W
Address range: 6000 to 6599
Direction: E-W
Address range: 6000 to 6599
Eby Rd (Co Hwy 73)
Length: 0.27 miles
Direction: N-S
Address range: 1 to 319
Direction: N-S
Address range: 1 to 319
Barnard Rd (Twp Hwy 302)
Length: 0.19 miles
Direction: N-S
Address range: 1000 to 1199
Direction: N-S
Address range: 1000 to 1199
Valleywood Ct
Length: 0.08 miles
Direction: N-S
Address range: 800 to 899
Direction: N-S
Address range: 800 to 899
Maplewood Ct
Length: 0.03 miles
Direction: SW-NE
Address range: 800 to 899
Direction: SW-NE
Address range: 800 to 899
Other features:
Apple Crk
Length: 2.81 miles
Directions: E-W, N-S, SE-NW, SW-NE
Directions: E-W, N-S, SE-NW, SW-NE