Hollydale Business District neighborhood in South Gate, California (CA), 90280, 90723 detailed profile
Settings
X


Business Search - 14 Million verified businesses
Area: 0.075 square miles
Population: 1,048
Population density:
| Hollydale Business District: | 13,892 people per square mile |
| South Gate: | 12,346 people per square mile |

- 83656.4%Hispanic or Latino
- 55737.6%Black
- 412.8%Asian
- 302.0%White
- 110.7%American Indian
- 60.4%Two or more races

Median household income in 2022:
| Hollydale Business District: | $73,102 |
| South Gate: | $70,939 |
Distribution of median household income
![Distribution of median household income]()
- 7Less than $10,000
- 17$10,000 to $19,999
- 17$20,000 to $29,999
- 92$30,000 to $39,999
- 32$40,000 to $49,999
- 20$50,000 to $59,999
- 57$60,000 to $74,999
- 35$75,000 to $99,999
- 53$100,000 to $124,999
- 34$125,000 to $149,999
- 18$150,000 to $199,999
- 28$200,000 or more

Distribution of owner-occupied house/condo value
![Distribution of owner-occupied house/condo value]()
- 3Less than $50,000
- 4$50,000 to $99,999
- 2$100,000 to $149,999
- 3$250,000 to $299,999
- 16$300,000 to $399,999
- 36$400,000 to $499,999
- 72$500,000 to $749,999
- 11$750,000 to $999,999
- 5$1,000,000 or more

Distribution of rent paid by renters
![Distribution of rent paid by renters]()
- 7$300 to $399
- 6$400 to $499
- 4$500 to $599
- 3$700 to $799
- 8$900 to $999
- 6$1,000 to $1,249
- 24$1,250 to $1,499
- 53$1,500 to $1,999
- 260$2,000 or more

Median rent in 2022:
| Hollydale Business District: | $1,642 |
| South Gate: | $1,326 |
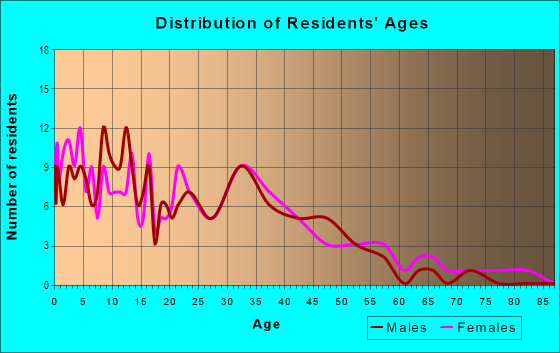
| Males: | 533 |
| Females: | 515 |
Males:
| This neighborhood: | 32.0 years |
| Whole city: | 35.2 years |
| This neighborhood: | 34.7 years |
| Whole city: | 34.6 years |
Average household size:
| Hollydale Business District: | 3.7 people |
| South Gate: | 3.6 people |
Percentage of family households:
| Hollydale Business District: | 57.5% |
| South Gate: | 54.9% |
| Here: | 49.1% |
| South Gate: | 49.6% |
Percentage of married-couple families with children (among all households):
| Hollydale Business District: | 20.8% |
| South Gate: | 17.0% |
Percentage of single-mother households (among all households):
| Hollydale Business District: | 6.1% |
| South Gate: | 7.6% |
Percentage of never married males 15 years old and over:
Percentage of never married females 15 years old and over:
| Hollydale Business District: | 24.5% |
| South Gate: | 21.7% |
Percentage of never married females 15 years old and over:
| Hollydale Business District: | 20.9% |
| city: | 22.9% |
Percentage of people that speak English not well or not at all:
| Hollydale Business District: | 11.4% |
| South Gate: | 22.7% |
Percentage of people born in this state:
Percentage of people born in another U.S. state:
Percentage of native residents but born outside the U.S.:
Percentage of foreign born residents:
| Here: | 63.6% |
| South Gate: | 56.0% |
Percentage of people born in another U.S. state:
| Hollydale Business District: | 3.8% |
| South Gate: | 3.0% |
Percentage of native residents but born outside the U.S.:
| Here: | 1.4% |
| city: | 1.2% |
Percentage of foreign born residents:
| Here: | 31.2% |
| South Gate: | 39.8% |

Owner-occupied
Renter-occupied


- Rooms in owner-occupied houses and condos in Hollydale Business District
- 31 room
- 52 rooms
- 23 rooms
- 314 rooms
- 235 rooms
- 426 rooms
- 77 rooms
- 128 rooms
- 169+ rooms

- Rooms in renter-occupied apartments in Hollydale Business District
- 101 room
- 292 rooms
- 263 rooms
- 824 rooms
- 455 rooms
- 96 rooms
- 77 rooms
- 88 rooms
- 09+ rooms
Owner-occupied
Renter-occupied

- Bedrooms in owner-occupied houses and condos in Hollydale Business District
- 3no bedroom
- 01 bedroom
- 442 bedrooms
- 483 bedrooms
- 334 bedrooms
- 45+ bedrooms

- Bedrooms in renter-occupied apartments in Hollydale Business District
- 15no bedroom
- 271 bedroom
- 992 bedrooms
- 193 bedrooms
- 74 bedrooms
- 85+ bedrooms
Average number of cars or other vehicles available in houses/condos:
Average number of cars or other vehicles available in apartments:
| This neighborhood: | 2.8 |
| South Gate: | 2.8 |
Average number of cars or other vehicles available in apartments:
| Here: | 1.6 |
| city: | 1.6 |
Percentage of units with a mortgage:
| Hollydale Business District: | 79.4% |
| South Gate: | 71.1% |
Average estimated value of detached houses in 2022 (46.8% of all units):
| Hollydale Business District: | $594,488 |
| California: | $988,808 |

- Year house built in Hollydale Business District
- 02020 or later
- 202010 to 2019
- 512000 to 2009
- 811990 to 1999
- 551980 to 1989
- 251970 to 1979
- 251960 to 1969
- 631950 to 1959
- 191940 to 1949
- 141939 or earlier

City-data.com crime index for city in 2020 (higher means more crime):
| City: | 346.8 |
| U.S. average: | 219.5 |
Travel time to work (commute)
![Travel time to work (commute)]()
- 5Less than 5 minutes
- 245 to 9 minutes
- 6710 to 14 minutes
- 4815 to 19 minutes
- 5720 to 24 minutes
- 1425 to 29 minutes
- 12730 to 34 minutes
- 1535 to 39 minutes
- 740 to 44 minutes
- 3645 to 59 minutes
- 3660 to 89 minutes
- 2990 or more minutes

Means of transportation to work
![Means of transportation to work]()
- 70.0%363Drove a car alone
- 11.0%57Carpooled
- 1.9%10Bus
- 1.2%6Taxi
- 4.1%21Motorcycle
- 1.4%7Bicycle
- 1.9%10Walked
- 1.7%9Other means
- 12.2%63Worked at home

Time leaving home to go to work
![Time leaving home to go to work]()
- 5912:00 a.m. to 4:59 a.m.
- 365:00 a.m. to 5:29 a.m.
- 285:30 a.m. to 5:59 a.m.
- 596:00 a.m. to 6:29 a.m.
- 456:30 a.m. to 6:59 a.m.
- 467:00 a.m. to 7:29 a.m.
- 317:30 a.m. to 7:59 a.m.
- 268:00 a.m. to 8:29 a.m.
- 198:30 a.m. to 8:59 a.m.
- 419:00 a.m. to 9:59 a.m.
- 710:00 a.m. to 10:59 a.m.
- 211:00 a.m. to 11:59 a.m.
- 2112:00 p.m. to 3:59 p.m.
- 314:00 p.m. to 11:59 p.m.

Occupations of males:
- Percentage of males in management occupations (except farmers):
Here: 3.2% city: 4.1%
- Percentage of males in business and financial operations occupations:
Here: 2.7% city: 2.2%
- Percentage of males in computer and mathematical occupations:
Here: 2.4% city: 1.4%
- Percentage of males in education, training, and library occupations:
Here: 2.0% city: 2.4%
- Percentage of males in arts, design, entertainment, sports, and media occupations:
Here: 3.2% city: 0.7%
- Percentage of males in healthcare practitioners and technical occupations:
Here: 4.2% city: 1.1%
- Percentage of males in service occupations:
Here: 19.1% city: 14.7%
- Percentage of males in sales and office occupations:
Here: 11.1% city: 17.5%
- Percentage of males in construction, extraction, and maintenance occupations:
Here: 17.1% city: 12.8%
- Percentage of males in production occupations:
Here: 8.5% city: 13.8%
- Percentage of males in transportation occupations:
Here: 9.5% city: 13.4%
- Percentage of males in material moving occupations:
Here: 9.5% city: 9.8%
Occupations of females:
- Percentage of females in management occupations (except farmers):
Here: 4.6% city: 6.5%
- Percentage of females in business and financial operations occupations:
Here: 4.8% city: 3.4%
- Percentage of females in computer and mathematical occupations:
Here: 2.1% city: 0.2%
- Percentage of females in community and social services occupations:
Here: 1.3% city: 3.1%
- Percentage of females in education, training, and library occupations:
Here: 8.0% city: 6.0%
- Percentage of females in healthcare practitioners and technical occupations:
Here: 11.6% city: 5.4%
- Percentage of females in service occupations:
Here: 31.9% city: 25.8%
- Percentage of females in sales and office occupations:
Here: 25.4% city: 31.9%
- Percentage of females in production occupations:
Here: 3.2% city: 7.6%
- Percentage of females in transportation occupations:
Here: 2.3% city: 2.5%
- Percentage of females in material moving occupations:
Here: 4.8% city: 5.7%
Education in this neighborhood (subdivision or community):
- Percentage of people 3 years and older in K-12 schools:
Hollydale Business District: 24.4% South Gate: 17.4%
- Percentage of people 3 years and older in undergraduate colleges:
Hollydale Business District: 6.3% South Gate: 6.9%
- Percentage of people 3 years and older in grad. or professional schools:
Hollydale Business District: 3.3% South Gate: 1.3%
- Percentage of students K-12 enrolled in private schools:
Hollydale Business District: 13.4% South Gate: 4.9%
Percentage of population below poverty level:
| Hollydale Business District: | 10.7% |
| South Gate: | 17.5% |
Median year owner moved in (as recorded in 2022):
Median year renter moved in (as recorded in 2022):
| Hollydale Business District: | 2010 |
| South Gate: | 2002 |
Median year renter moved in (as recorded in 2022):
| Hollydale Business District: | 2014 |
| South Gate: | 2016 |
Percentage of married-couple families with both working:
| Hollydale Business District: | 66.0% |
| South Gate: | 47.0% |

- 52.0%Utility gas
- 36.7%Electricity
- 9.1%No fuel used
- 2.2%Bottled, tank, or LP gas
Roads and streets:
Garfield Ave
Length: 0.62 miles
Directions: N-S, SE-NW
Address range: 11600 to 13723
Directions: N-S, SE-NW
Address range: 11600 to 13723
Utah Ave
Length: 0.31 miles
Direction: N-S
Address range: 11800 to 12199
Direction: N-S
Address range: 11800 to 12199
Century Blvd
Length: 0.16 miles
Direction: SE-NW
Address range: 5671 to 5763
Direction: SE-NW
Address range: 5671 to 5763
McKinley Ave
Length: 0.12 miles
Direction: E-W
Address range: 5636 to 5719
Direction: E-W
Address range: 5636 to 5719
Main St
Length: 0.11 miles
Direction: E-W
Address range: 5636 to 5715
Direction: E-W
Address range: 5636 to 5715
Walnut Ave
Length: 0.06 miles
Directions: E-W, SE-NW
Address range: 7458 to 7499
Directions: E-W, SE-NW
Address range: 7458 to 7499
Jefferson Ave
Length: 0.04 miles
Direction: E-W
Address range: 5700 to 5721
Direction: E-W
Address range: 5700 to 5721
Wilson Ave
Length: 0.04 miles
Direction: E-W
Address range: 5700 to 5717
Direction: E-W
Address range: 5700 to 5717
Cortland Ave
Length: 0.04 miles
Direction: E-W
Address range: 7431 to 7499
Direction: E-W
Address range: 7431 to 7499
Roosevelt Ave
Length: 0.04 miles
Direction: E-W
Address range: 5700 to 5715
Direction: E-W
Address range: 5700 to 5715
Lincoln Ave
Length: 0.03 miles
Direction: E-W
Address range: 5700 to 5715
Direction: E-W
Address range: 5700 to 5715
Harding Ave
Length: 0.03 miles
Direction: E-W
Address range: 5700 to 5715
Direction: E-W
Address range: 5700 to 5715
Florence Ave
Length: 0.01 miles
Direction: E-W
Address range: 5700 to 5705
Direction: E-W
Address range: 5700 to 5705