Historic District (Silk Stocking District) neighborhood in Blue Island, Illinois (IL), 60406 detailed profile
Settings
X


Business Search - 14 Million verified businesses
Area: 0.329 square miles
Population: 2,061
Population density:
| Historic District (Silk Stocking District): | 6,262 people per square mile |
| Blue Island: | 5,691 people per square mile |

- 1,11550.3%Hispanic or Latino
- 58526.4%Black
- 42719.3%White
- 904.1%Two or more races
- 10.05%Asian

Distribution of median household income
![Distribution of median household income]()
- 87Less than $10,000
- 117$10,000 to $19,999
- 212$20,000 to $29,999
- 212$30,000 to $39,999
- 82$40,000 to $49,999
- 99$50,000 to $59,999
- 117$60,000 to $74,999
- 94$75,000 to $99,999
- 69$100,000 to $124,999
- 25$125,000 to $149,999
- 27$150,000 to $199,999
- 53$200,000 or more

Distribution of owner-occupied house/condo value
![Distribution of owner-occupied house/condo value]()
- 155Less than $50,000
- 201$50,000 to $99,999
- 146$100,000 to $149,999
- 75$150,000 to $199,999
- 75$200,000 to $249,999
- 19$250,000 to $299,999
- 66$300,000 to $399,999
- 26$400,000 to $499,999
- 4$500,000 to $749,999
- 4$750,000 to $999,999

Distribution of rent paid by renters
![Distribution of rent paid by renters]()
- 4$200 to $299
- 7$300 to $399
- 12$400 to $499
- 116$500 to $599
- 117$600 to $699
- 182$700 to $799
- 178$800 to $899
- 92$900 to $999
- 127$1,000 to $1,249
- 29$1,250 to $1,499
- 45$1,500 to $1,999
- 6$2,000 or more

Median rent in 2022:
| Historic District (Silk Stocking District): | $780 |
| Blue Island: | $903 |
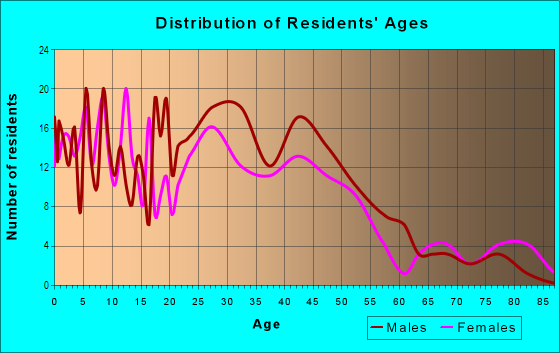
| Males: | 1,021 |
| Females: | 1,039 |
Males:
| This neighborhood: | 40.3 years |
| Whole city: | 33.7 years |
| This neighborhood: | 42.0 years |
| Whole city: | 38.4 years |
Average household size:
| Historic District (Silk Stocking District): | 4.5 people |
| Blue Island: | 2.7 people |
Percentage of family households:
| Historic District (Silk Stocking District): | 44.9% |
| Blue Island: | 49.7% |
| Here: | 29.1% |
| Blue Island: | 31.9% |
Percentage of married-couple families with children (among all households):
| Historic District (Silk Stocking District): | 21.0% |
| Blue Island: | 19.3% |
Percentage of single-mother households (among all households):
| Historic District (Silk Stocking District): | 16.5% |
| Blue Island: | 15.9% |
Percentage of never married males 15 years old and over:
Percentage of never married females 15 years old and over:
| Historic District (Silk Stocking District): | 21.1% |
| Blue Island: | 24.9% |
Percentage of never married females 15 years old and over:
| Historic District (Silk Stocking District): | 23.8% |
| city: | 22.9% |
Percentage of people that speak English not well or not at all:
| Historic District (Silk Stocking District): | 9.7% |
| Blue Island: | 8.7% |
Percentage of people born in this state:
Percentage of people born in another U.S. state:
Percentage of native residents but born outside the U.S.:
Percentage of foreign born residents:
| Here: | 67.6% |
| Blue Island: | 69.7% |
Percentage of people born in another U.S. state:
| Historic District (Silk Stocking District): | 8.4% |
| Blue Island: | 7.8% |
Percentage of native residents but born outside the U.S.:
| Here: | 2.2% |
| city: | 1.5% |
Percentage of foreign born residents:
| Here: | 22.4% |
| Blue Island: | 21.0% |

Owner-occupied
Renter-occupied


- Rooms in owner-occupied houses and condos in Historic District <
> - 01 room
- 342 rooms
- 273 rooms
- 454 rooms
- 355 rooms
- 706 rooms
- 747 rooms
- 668 rooms
- 859+ rooms

- Rooms in renter-occupied apartments in Historic District <
> - 811 room
- 592 rooms
- 1413 rooms
- 2524 rooms
- 865 rooms
- 256 rooms
- 1007 rooms
- 328 rooms
- 89+ rooms
Owner-occupied
Renter-occupied

- Bedrooms in owner-occupied houses and condos in Historic District <
> - 2no bedroom
- 541 bedroom
- 492 bedrooms
- 1713 bedrooms
- 324 bedrooms
- 725+ bedrooms

- Bedrooms in renter-occupied apartments in Historic District <
> - 88no bedroom
- 1731 bedroom
- 2532 bedrooms
- 403 bedrooms
- 564 bedrooms
- 85+ bedrooms
Average number of cars or other vehicles available in houses/condos:
Average number of cars or other vehicles available in apartments:
| This neighborhood: | 1.7 |
| Blue Island: | 1.9 |
Average number of cars or other vehicles available in apartments:
| Here: | 1.2 |
| city: | 1.1 |
Percentage of units with a mortgage:
| Historic District (Silk Stocking District): | 26.0% |
| Blue Island: | 52.0% |
Average estimated value of detached houses in 2022 (39.6% of all units):
| Historic District (Silk Stocking District): | $239,609 |
| Illinois: | $310,164 |

- Year house built in Historic District <
> - 02020 or later
- 1222010 to 2019
- 1432000 to 2009
- 881990 to 1999
- 561980 to 1989
- 1081970 to 1979
- 1811960 to 1969
- 1221950 to 1959
- 1111940 to 1949
- 3701939 or earlier

City-data.com crime index for city in 2020 (higher means more crime):
| City: | 156.2 |
| U.S. average: | 219.5 |
Travel time to work (commute)
![Travel time to work (commute)]()
- 15Less than 5 minutes
- 825 to 9 minutes
- 7710 to 14 minutes
- 13515 to 19 minutes
- 17320 to 24 minutes
- 3425 to 29 minutes
- 18030 to 34 minutes
- 5135 to 39 minutes
- 4140 to 44 minutes
- 15245 to 59 minutes
- 6960 to 89 minutes
- 1990 or more minutes

Means of transportation to work
![Means of transportation to work]()
- 78.4%711Drove a car alone
- 11.7%106Carpooled
- 4.1%37Bus
- 9.7%88Subway or elevated rail
- 3.5%32Long-distance train or commuter rail
- 3.1%28Light rail, streetcar or trolley
- 2.9%26Ferryboat
- 1.8%16Taxi
- 0.1%1Bicycle
- 4.7%43Walked
- 3.9%35Other means
- 7.4%67Worked at home

Time leaving home to go to work
![Time leaving home to go to work]()
- 8212:00 a.m. to 4:59 a.m.
- 825:00 a.m. to 5:29 a.m.
- 505:30 a.m. to 5:59 a.m.
- 586:00 a.m. to 6:29 a.m.
- 876:30 a.m. to 6:59 a.m.
- 1217:00 a.m. to 7:29 a.m.
- 757:30 a.m. to 7:59 a.m.
- 828:00 a.m. to 8:29 a.m.
- 308:30 a.m. to 8:59 a.m.
- 569:00 a.m. to 9:59 a.m.
- 2110:00 a.m. to 10:59 a.m.
- 611:00 a.m. to 11:59 a.m.
- 13012:00 p.m. to 3:59 p.m.
- 894:00 p.m. to 11:59 p.m.

Occupations of males:
- Percentage of males in management occupations (except farmers):
Here: 4.4% city: 6.2%
- Percentage of males in business and financial operations occupations:
Here: 2.7% city: 1.8%
- Percentage of males in computer and mathematical occupations:
Here: 1.1% city: 1.0%
- Percentage of males in service occupations:
Here: 22.0% city: 16.8%
- Percentage of males in sales and office occupations:
Here: 12.7% city: 13.5%
- Percentage of males in construction, extraction, and maintenance occupations:
Here: 18.0% city: 18.9%
- Percentage of males in production occupations:
Here: 19.6% city: 12.0%
- Percentage of males in transportation occupations:
Here: 4.7% city: 7.5%
- Percentage of males in material moving occupations:
Here: 7.3% city: 10.7%
Occupations of females:
- Percentage of females in management occupations (except farmers):
Here: 12.8% city: 9.0%
- Percentage of females in business and financial operations occupations:
Here: 1.6% city: 3.7%
- Percentage of females in community and social services occupations:
Here: 1.3% city: 1.8%
- Percentage of females in education, training, and library occupations:
Here: 6.4% city: 6.5%
- Percentage of females in healthcare practitioners and technical occupations:
Here: 1.3% city: 7.0%
- Percentage of females in service occupations:
Here: 25.0% city: 30.5%
- Percentage of females in sales and office occupations:
Here: 35.9% city: 26.7%
- Percentage of females in production occupations:
Here: 7.2% city: 8.0%
- Percentage of females in material moving occupations:
Here: 7.4% city: 2.5%
Percentage of people 16-64 in Armed Forces:
| Historic District (Silk Stocking District): | 0.0% |
| Blue Island: | 0.0% |
Education in this neighborhood (subdivision or community):
- Percentage of people 3 years and older in K-12 schools:
Historic District (Silk Stocking District): 34.4% Blue Island: 17.3%
- Percentage of people 3 years and older in undergraduate colleges:
Historic District (Silk Stocking District): 7.1% Blue Island: 5.0%
- Percentage of people 3 years and older in grad. or professional schools:
Historic District (Silk Stocking District): 3.9% Blue Island: 1.1%
- Percentage of students K-12 enrolled in private schools:
Historic District (Silk Stocking District): 25.9% Blue Island: 7.9%
Percentage of population below poverty level:
| Historic District (Silk Stocking District): | 17.0% |
| Blue Island: | 18.7% |
Median year owner moved in (as recorded in 2022):
| Historic District (Silk Stocking District): | 1997 |
| Blue Island: | 2002 |
Percentage of married-couple families with both working:
| Historic District (Silk Stocking District): | 71.5% |
| Blue Island: | 47.0% |

- 69.3%Utility gas
- 19.6%Electricity
- 7.9%Bottled, tank, or LP gas
- 2.3%No fuel used
- 1.0%Fuel oil, kerosene, etc.
Roads and streets:
Broadway St (Broadway)
Length: 0.72 miles
Directions: E-W, SW-NE
Address range: 2130 to 2599
Directions: E-W, SW-NE
Address range: 2130 to 2599
Vermont St
Length: 0.72 miles
Direction: E-W
Address range: 2139 to 2599
Direction: E-W
Address range: 2139 to 2599
Western Ave
Length: 0.60 miles
Directions: N-S, SE-NW
Address range: 12937 to 13329
Directions: N-S, SE-NW
Address range: 12937 to 13329
Grove St
Length: 0.55 miles
Direction: E-W
Address range: 2131 to 2528
Direction: E-W
Address range: 2131 to 2528
York St
Length: 0.52 miles
Direction: E-W
Address range: 2200 to 2573
Direction: E-W
Address range: 2200 to 2573
New St
Length: 0.48 miles
Direction: E-W
Address range: 2300 to 2553
Direction: E-W
Address range: 2300 to 2553
Gregory St
Length: 0.43 miles
Directions: N-S, SW-NE
Address range: 12938 to 13331
Directions: N-S, SW-NE
Address range: 12938 to 13331
Canal St
Length: 0.42 miles
Directions: E-W, SW-NE
Address range: 2016 to 2439
Directions: E-W, SW-NE
Address range: 2016 to 2439
High St
Length: 0.42 miles
Direction: E-W
Address range: 2300 to 2573
Direction: E-W
Address range: 2300 to 2573
Irving Ave
Length: 0.36 miles
Directions: N-S, SE-NW, SW-NE
Address range: 12909 to 13328
Directions: N-S, SE-NW, SW-NE
Address range: 12909 to 13328
Greenwood Ave
Length: 0.35 miles
Directions: N-S, SE-NW, SW-NE
Address range: 12927 to 13199
Directions: N-S, SE-NW, SW-NE
Address range: 12927 to 13199
Chatham St
Length: 0.34 miles
Direction: N-S
Address range: 13100 to 13331
Direction: N-S
Address range: 13100 to 13331
Fulton St
Length: 0.31 miles
Direction: E-W
Address range: 2130 to 2299
Direction: E-W
Address range: 2130 to 2299
Chicago St
Length: 0.31 miles
Directions: N-S, SW-NE
Address range: 13000 to 13330
Directions: N-S, SW-NE
Address range: 13000 to 13330
Old Western Ave
Length: 0.29 miles
Directions: N-S, SW-NE
Address range: 13100 to 13329
Directions: N-S, SW-NE
Address range: 13100 to 13329
Ann St
Length: 0.26 miles
Direction: N-S
Address range: 13100 to 13399
Direction: N-S
Address range: 13100 to 13399
James St
Length: 0.22 miles
Direction: E-W
Address range: 2400 to 2599
Direction: E-W
Address range: 2400 to 2599
Artesian Ave
Length: 0.14 miles
Direction: N-S
Address range: 13100 to 13199
Direction: N-S
Address range: 13100 to 13199
Rexford St
Length: 0.10 miles
Direction: N-S
Address range: 13100 to 13328
Direction: N-S
Address range: 13100 to 13328
Artesian St
Length: 0.03 miles
Direction: N-S
Direction: N-S
Railroad features:
Soo Line RR
Length: 1.17 miles
Directions: N-S, SW-NE
Directions: N-S, SW-NE