Historic Conley Hills neighborhood in Atlanta, Georgia (GA), 30344 detailed profile
Settings
X


Business Search - 14 Million verified businesses
Area: 0.256 square miles
Population: 1,126
Population density:
| Historic Conley Hills: | 4,391 people per square mile |
| Atlanta: | 3,788 people per square mile |

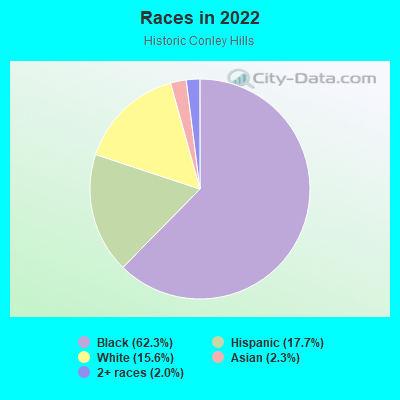
- 72562.3%Black
- 20617.7%Hispanic or Latino
- 18215.6%White
- 272.3%Asian
- 232.0%Two or more races
Median household income in 2022:
| Historic Conley Hills: | $57,136 |
| Atlanta: | $83,251 |
Distribution of median household income
![Distribution of median household income]()
- 16Less than $10,000
- 59$10,000 to $19,999
- 102$20,000 to $29,999
- 28$30,000 to $39,999
- 26$40,000 to $49,999
- 20$50,000 to $59,999
- 193$60,000 to $74,999
- 59$75,000 to $99,999
- 60$100,000 to $124,999
- 28$125,000 to $149,999
- 31$150,000 to $199,999
- 6$200,000 or more

Distribution of owner-occupied house/condo value
![Distribution of owner-occupied house/condo value]()
- 48Less than $50,000
- 29$50,000 to $99,999
- 8$100,000 to $149,999
- 53$150,000 to $199,999
- 77$200,000 to $249,999
- 50$250,000 to $299,999
- 8$300,000 to $399,999
- 14$400,000 to $499,999

Distribution of rent paid by renters
![Distribution of rent paid by renters]()
- 3Less than $100
- 3$100 to $199
- 4$500 to $599
- 18$600 to $699
- 58$700 to $799
- 74$800 to $899
- 12$900 to $999
- 44$1,000 to $1,249
- 88$1,250 to $1,499
- 28$1,500 to $1,999

Median rent in 2022:
| Historic Conley Hills: | $895 |
| Atlanta: | $1,477 |
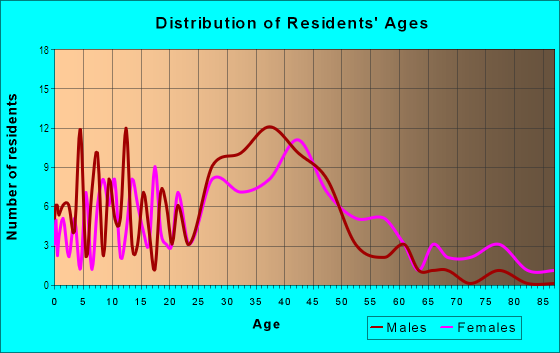
| Males: | 362 |
| Females: | 763 |
Males:
| This neighborhood: | 29.2 years |
| Whole city: | 33.7 years |
| This neighborhood: | 33.7 years |
| Whole city: | 34.3 years |
Average household size:
| Historic Conley Hills: | 12.6 people |
| Atlanta: | 2.0 people |
Percentage of family households:
| Historic Conley Hills: | 34.4% |
| Atlanta: | 31.6% |
| Here: | 13.7% |
| Atlanta: | 24.9% |
Percentage of married-couple families with children (among all households):
| Historic Conley Hills: | 9.5% |
| Atlanta: | 23.2% |
Percentage of single-mother households (among all households):
| Historic Conley Hills: | 10.7% |
| Atlanta: | 22.0% |
Percentage of never married males 15 years old and over:
Percentage of never married females 15 years old and over:
| Historic Conley Hills: | 15.0% |
| Atlanta: | 28.0% |
Percentage of never married females 15 years old and over:
| Historic Conley Hills: | 27.7% |
| city: | 26.3% |
Percentage of people that speak English not well or not at all:
| Historic Conley Hills: | 0.4% |
| Atlanta: | 1.0% |
Percentage of people born in this state:
Percentage of people born in another U.S. state:
Percentage of native residents but born outside the U.S.:
Percentage of foreign born residents:
| Here: | 57.7% |
| Atlanta: | 46.3% |
Percentage of people born in another U.S. state:
| Historic Conley Hills: | 32.2% |
| Atlanta: | 43.2% |
Percentage of native residents but born outside the U.S.:
| Here: | 2.4% |
| city: | 2.0% |
Percentage of foreign born residents:
| Here: | 7.7% |
| Atlanta: | 8.5% |
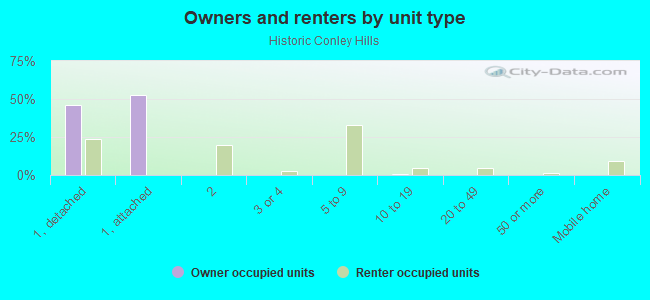
Owner-occupied
Renter-occupied

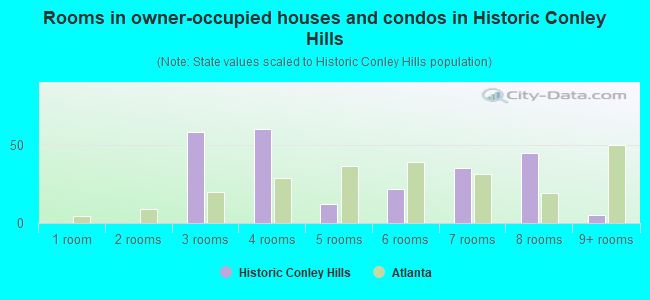
- Rooms in owner-occupied houses and condos in Historic Conley Hills
- 01 room
- 02 rooms
- 583 rooms
- 604 rooms
- 125 rooms
- 226 rooms
- 357 rooms
- 458 rooms
- 59+ rooms
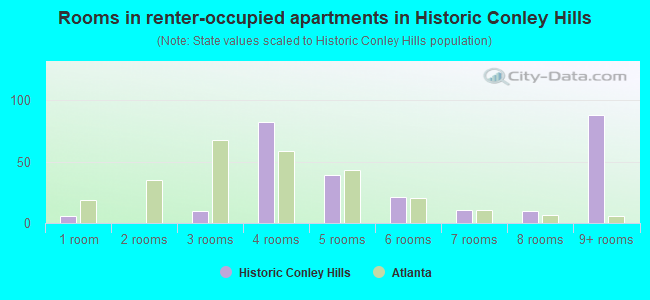
- Rooms in renter-occupied apartments in Historic Conley Hills
- 61 room
- 02 rooms
- 103 rooms
- 824 rooms
- 395 rooms
- 216 rooms
- 117 rooms
- 108 rooms
- 889+ rooms
Owner-occupied
Renter-occupied
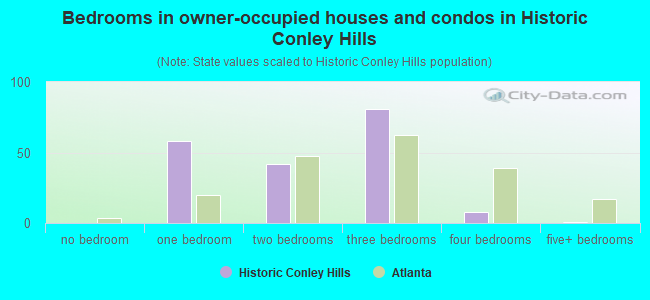
- Bedrooms in owner-occupied houses and condos in Historic Conley Hills
- 0no bedroom
- 581 bedroom
- 422 bedrooms
- 813 bedrooms
- 84 bedrooms
- 15+ bedrooms
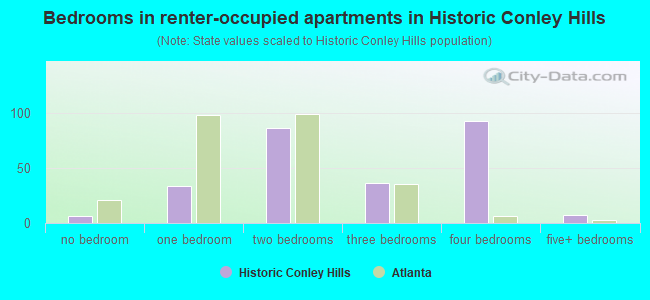
- Bedrooms in renter-occupied apartments in Historic Conley Hills
- 6no bedroom
- 341 bedroom
- 862 bedrooms
- 363 bedrooms
- 934 bedrooms
- 75+ bedrooms
Average number of cars or other vehicles available in houses/condos:
Average number of cars or other vehicles available in apartments:
| This neighborhood: | 1.2 |
| Atlanta: | 1.6 |
Average number of cars or other vehicles available in apartments:
| Here: | 1.0 |
| city: | 1.0 |
Percentage of units with a mortgage:
| Historic Conley Hills: | 64.8% |
| Atlanta: | 72.0% |
Average estimated value of detached houses in 2022 (53.8% of all units):
| Historic Conley Hills: | $258,494 |
| Atlanta: | $673,143 |
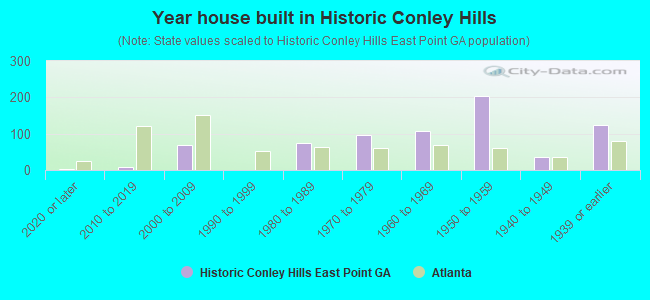
- Year house built in Historic Conley Hills
- 42020 or later
- 82010 to 2019
- 702000 to 2009
- 11990 to 1999
- 731980 to 1989
- 951970 to 1979
- 1071960 to 1969
- 2031950 to 1959
- 371940 to 1949
- 1251939 or earlier
City-data.com crime index for city in 2020 (higher means more crime):
| City: | 140.2 |
| U.S. average: | 219.5 |
Travel time to work (commute)
![Travel time to work (commute)]()
- 22Less than 5 minutes
- 235 to 9 minutes
- 1510 to 14 minutes
- 3615 to 19 minutes
- 6320 to 24 minutes
- 4225 to 29 minutes
- 7130 to 34 minutes
- 635 to 39 minutes
- 2140 to 44 minutes
- 745 to 59 minutes
- 3960 to 89 minutes
- 890 or more minutes

Means of transportation to work
![Means of transportation to work]()
- 58.2%229Drove a car alone
- 8.6%34Carpooled
- 12.2%48Bus
- 14.0%55Subway or elevated rail
- 1.8%7Long-distance train or commuter rail
- 1.5%6Light rail, streetcar or trolley
- 9.4%37Taxi
- 1.8%7Motorcycle
- 5.8%23Walked
- 14.2%56Worked at home

Time leaving home to go to work
![Time leaving home to go to work]()
- 1212:00 a.m. to 4:59 a.m.
- 55:00 a.m. to 5:29 a.m.
- 15:30 a.m. to 5:59 a.m.
- 476:00 a.m. to 6:29 a.m.
- 656:30 a.m. to 6:59 a.m.
- 487:00 a.m. to 7:29 a.m.
- 177:30 a.m. to 7:59 a.m.
- 688:00 a.m. to 8:29 a.m.
- 288:30 a.m. to 8:59 a.m.
- 369:00 a.m. to 9:59 a.m.
- 2510:00 a.m. to 10:59 a.m.
- 611:00 a.m. to 11:59 a.m.
- 2112:00 p.m. to 3:59 p.m.
- 74:00 p.m. to 11:59 p.m.

Occupations of males:
- Percentage of males in management occupations (except farmers):
Here: 21.9% city: 16.5%
- Percentage of males in computer and mathematical occupations:
Here: 9.5% city: 8.5%
- Percentage of males in architecture and engineering occupations:
Here: 3.8% city: 4.2%
- Percentage of males in education, training, and library occupations:
Here: 7.1% city: 5.1%
- Percentage of males in arts, design, entertainment, sports, and media occupations:
Here: 39.7% city: 4.8%
- Percentage of males in service occupations:
Here: 28.3% city: 11.5%
- Percentage of males in sales and office occupations:
Here: 3.4% city: 15.1%
- Percentage of males in construction, extraction, and maintenance occupations:
Here: 5.5% city: 2.4%
Occupations of females:
- Percentage of females in management occupations (except farmers):
Here: 81.5% city: 14.0%
- Percentage of females in business and financial operations occupations:
Here: 21.6% city: 10.8%
- Percentage of females in computer and mathematical occupations:
Here: 3.0% city: 3.2%
- Percentage of females in architecture and engineering occupations:
Here: 17.1% city: 1.4%
- Percentage of females in life, physical, and social science occupations:
Here: 4.0% city: 1.9%
- Percentage of females in legal occupations:
Here: 30.1% city: 3.1%
- Percentage of females in education, training, and library occupations:
Here: 32.7% city: 8.9%
- Percentage of females in arts, design, entertainment, sports, and media occupations:
Here: 12.8% city: 4.9%
- Percentage of females in service occupations:
Here: 43.9% city: 13.9%
- Percentage of females in sales and office occupations:
Here: 3.3% city: 21.9%
- Percentage of females in production occupations:
Here: 12.3% city: 1.9%
- Percentage of females in material moving occupations:
Here: 4.5% city: 1.6%
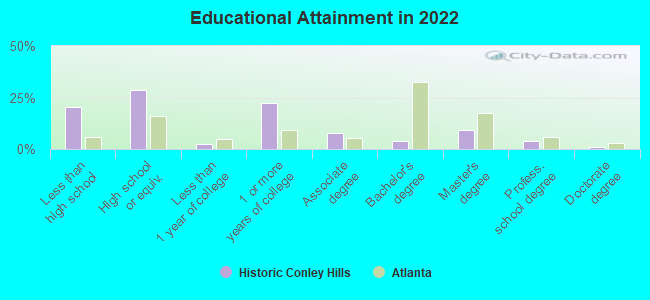
Education in this neighborhood (subdivision or community):
- Percentage of people 3 years and older in K-12 schools:
Historic Conley Hills: 37.6% Atlanta: 12.5%
- Percentage of people 3 years and older in undergraduate colleges:
Historic Conley Hills: 3.3% Atlanta: 8.9%
- Percentage of people 3 years and older in grad. or professional schools:
Historic Conley Hills: 4.4% Atlanta: 3.3%
- Percentage of students K-12 enrolled in private schools:
Historic Conley Hills: 3.1% Atlanta: 22.5%
Percentage of population below poverty level:
| Historic Conley Hills: | 20.5% |
| Atlanta: | 17.3% |
Median year owner moved in (as recorded in 2022):
Median year renter moved in (as recorded in 2022):
| Historic Conley Hills: | 2002 |
| Atlanta: | 2015 |
Median year renter moved in (as recorded in 2022):
| Historic Conley Hills: | 2018 |
| Atlanta: | 2020 |
Percentage of married-couple families with both working:
| Historic Conley Hills: | 99.7% |
| Atlanta: | 79.0% |
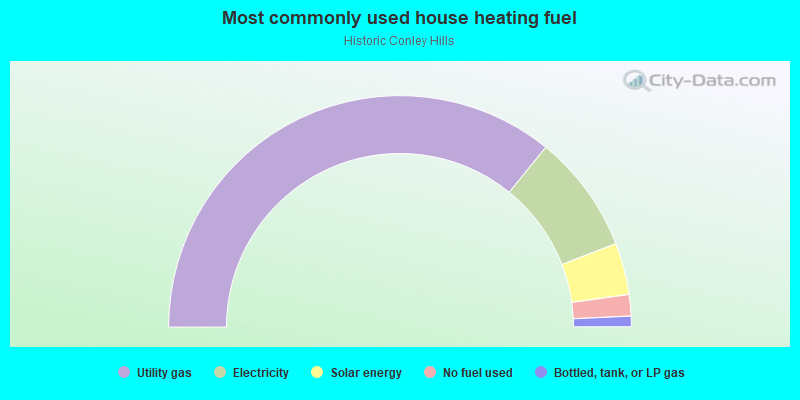
- 71.7%Utility gas
- 16.6%Electricity
- 7.2%Solar energy
- 3.0%No fuel used
- 1.5%Bottled, tank, or LP gas
Roads and streets:
Kimmeridge Dr
Length: 0.87 miles
Directions: N-S, SE-NW
Address range: 2401 to 3059
Directions: N-S, SE-NW
Address range: 2401 to 3059
Stanton St (Semmes St)
Length: 0.59 miles
Direction: N-S
Address range: 2600 to 2899
Direction: N-S
Address range: 2600 to 2899
Pearl St
Length: 0.45 miles
Direction: N-S
Address range: 2686 to 2927
Direction: N-S
Address range: 2686 to 2927
Linwood Ave
Length: 0.45 miles
Directions: E-W, SE-NW
Address range: 1800 to 1998
Directions: E-W, SE-NW
Address range: 1800 to 1998
Neely Ave
Length: 0.42 miles
Direction: E-W
Address range: 1800 to 1999
Direction: E-W
Address range: 1800 to 1999
Montrose Dr
Length: 0.41 miles
Direction: E-W
Address range: 1800 to 1999
Direction: E-W
Address range: 1800 to 1999
Thompson Ave
Length: 0.41 miles
Direction: E-W
Address range: 1800 to 2000
Direction: E-W
Address range: 1800 to 2000
Dorsey Ave
Length: 0.41 miles
Direction: E-W
Address range: 1800 to 1949
Direction: E-W
Address range: 1800 to 1949
Washington Ave (E Washington Rd)
Length: 0.40 miles
Directions: E-W, SW-NE
Address range: 1800 to 1957
Directions: E-W, SW-NE
Address range: 1800 to 1957
Westwood Ave
Length: 0.36 miles
Direction: E-W
Address range: 1800 to 1999
Direction: E-W
Address range: 1800 to 1999
Lexington Ave
Length: 0.25 miles
Directions: E-W, SE-NW
Address range: 1800 to 1998
Directions: E-W, SE-NW
Address range: 1800 to 1998
Warren Way
Length: 0.20 miles
Directions: N-S, SE-NW, SW-NE
Address range: 1800 to 1899
Directions: N-S, SE-NW, SW-NE
Address range: 1800 to 1899
Jones St
Length: 0.17 miles
Direction: N-S
Address range: 2800 to 2899
Direction: N-S
Address range: 2800 to 2899
8th St
Length: 0.16 miles
Direction: N-S
Address range: 2800 to 2944
Direction: N-S
Address range: 2800 to 2944
Headland Dr
Length: 0.15 miles
Direction: SE-NW
Address range: 1934 to 1999
Direction: SE-NW
Address range: 1934 to 1999