Hilltop Circle neighborhood in Roseville, California (CA), 95678, 95747 detailed profile
Settings
X


Business Search - 14 Million verified businesses
Area: 0.550 square miles
Population: 1,461
Population density:
| Hilltop Circle: | 2,657 people per square mile |
| Roseville: | 5,080 people per square mile |

- 75952.0%Hispanic or Latino
- 65444.8%White
- 261.8%Asian
- 211.4%Two or more races

Median household income in 2022:
| Hilltop Circle: | $44,128 |
| Roseville: | $100,739 |
Distribution of median household income
![Distribution of median household income]()
- 54Less than $10,000
- 53$10,000 to $19,999
- 64$20,000 to $29,999
- 52$30,000 to $39,999
- 85$40,000 to $49,999
- 19$50,000 to $59,999
- 42$60,000 to $74,999
- 66$75,000 to $99,999
- 59$100,000 to $124,999
- 26$125,000 to $149,999
- 16$150,000 to $199,999
- 14$200,000 or more

Distribution of owner-occupied house/condo value
![Distribution of owner-occupied house/condo value]()
- 23$100,000 to $149,999
- 21$150,000 to $199,999
- 9$200,000 to $249,999
- 16$250,000 to $299,999
- 101$300,000 to $399,999
- 40$400,000 to $499,999
- 15$500,000 to $749,999
- 2$750,000 to $999,999

Distribution of rent paid by renters
![Distribution of rent paid by renters]()
- 2$500 to $599
- 6$600 to $699
- 6$800 to $899
- 65$900 to $999
- 84$1,000 to $1,249
- 100$1,250 to $1,499
- 50$1,500 to $1,999

Median rent in 2022:
| Hilltop Circle: | $1,235 |
| Roseville: | $1,946 |
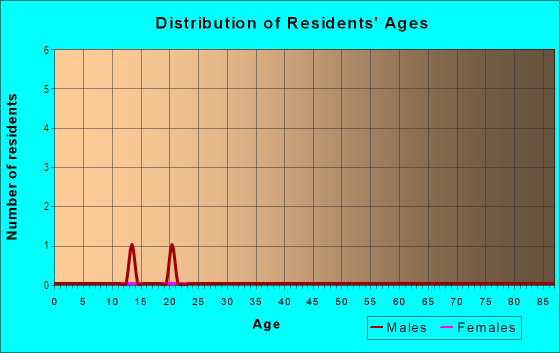
| Males: | 664 |
| Females: | 797 |
Males:
| This neighborhood: | 37.2 years |
| Whole city: | 39.8 years |
| This neighborhood: | 29.5 years |
| Whole city: | 45.1 years |
Average household size:
| Hilltop Circle: | 2.6 people |
| Roseville: | 2.5 people |
Percentage of family households:
| Hilltop Circle: | 39.7% |
| Roseville: | 46.4% |
| Here: | 25.1% |
| Roseville: | 52.5% |
Percentage of married-couple families with children (among all households):
| Hilltop Circle: | 18.7% |
| Roseville: | 31.8% |
Percentage of single-mother households (among all households):
| Hilltop Circle: | 16.4% |
| Roseville: | 4.7% |
Percentage of never married males 15 years old and over:
Percentage of never married females 15 years old and over:
| Hilltop Circle: | 24.7% |
| Roseville: | 16.5% |
Percentage of never married females 15 years old and over:
| Hilltop Circle: | 24.9% |
| city: | 11.4% |
Percentage of people that speak English not well or not at all:
| Hilltop Circle: | 0.0% |
| Roseville: | 2.1% |
Percentage of people born in this state:
Percentage of people born in another U.S. state:
Percentage of native residents but born outside the U.S.:
Percentage of foreign born residents:
| Here: | 73.4% |
| Roseville: | 61.6% |
Percentage of people born in another U.S. state:
| Hilltop Circle: | 10.3% |
| Roseville: | 20.5% |
Percentage of native residents but born outside the U.S.:
| Here: | 1.2% |
| city: | 2.8% |
Percentage of foreign born residents:
| Here: | 15.1% |
| Roseville: | 15.0% |

Owner-occupied
Renter-occupied


- Rooms in owner-occupied houses and condos in Hilltop Circle
- 01 room
- 02 rooms
- 63 rooms
- 184 rooms
- 605 rooms
- 386 rooms
- 847 rooms
- 138 rooms
- 29+ rooms

- Rooms in renter-occupied apartments in Hilltop Circle
- 91 room
- 482 rooms
- 923 rooms
- 1084 rooms
- 235 rooms
- 156 rooms
- 57 rooms
- 98 rooms
- 09+ rooms
Owner-occupied
Renter-occupied

- Bedrooms in owner-occupied houses and condos in Hilltop Circle
- 0no bedroom
- 41 bedroom
- 302 bedrooms
- 1293 bedrooms
- 624 bedrooms
- 05+ bedrooms

- Bedrooms in renter-occupied apartments in Hilltop Circle
- 19no bedroom
- 931 bedroom
- 1712 bedrooms
- 303 bedrooms
- 04 bedrooms
- 05+ bedrooms
Average number of cars or other vehicles available in houses/condos:
Average number of cars or other vehicles available in apartments:
| This neighborhood: | 2.3 |
| Roseville: | 2.1 |
Average number of cars or other vehicles available in apartments:
| Here: | 1.4 |
| city: | 1.5 |
Percentage of units with a mortgage:
| Hilltop Circle: | 63.9% |
| Roseville: | 72.1% |
Average estimated value of detached houses in 2022 (65.4% of all units):
| Hilltop Circle: | $331,501 |
| California: | $988,808 |

- Year house built in Hilltop Circle
- 02020 or later
- 82010 to 2019
- 52000 to 2009
- 41990 to 1999
- 581980 to 1989
- 571970 to 1979
- 601960 to 1969
- 1781950 to 1959
- 391940 to 1949
- 1581939 or earlier

City-data.com crime index for city in 2020 (higher means more crime):
| City: | 150.3 |
| U.S. average: | 219.5 |
Travel time to work (commute)
![Travel time to work (commute)]()
- 5Less than 5 minutes
- 815 to 9 minutes
- 7610 to 14 minutes
- 11515 to 19 minutes
- 10420 to 24 minutes
- 925 to 29 minutes
- 6130 to 34 minutes
- 1835 to 39 minutes
- 540 to 44 minutes
- 2145 to 59 minutes
- 2360 to 89 minutes
- 390 or more minutes

Means of transportation to work
![Means of transportation to work]()
- 71.8%498Drove a car alone
- 4.6%32Carpooled
- 2.9%20Bus
- 0.6%4Bicycle
- 5.3%37Walked
- 0.7%5Other means
- 13.4%93Worked at home

Time leaving home to go to work
![Time leaving home to go to work]()
- 3012:00 a.m. to 4:59 a.m.
- 145:00 a.m. to 5:29 a.m.
- 185:30 a.m. to 5:59 a.m.
- 406:00 a.m. to 6:29 a.m.
- 826:30 a.m. to 6:59 a.m.
- 837:00 a.m. to 7:29 a.m.
- 537:30 a.m. to 7:59 a.m.
- 348:00 a.m. to 8:29 a.m.
- 378:30 a.m. to 8:59 a.m.
- 339:00 a.m. to 9:59 a.m.
- 1810:00 a.m. to 10:59 a.m.
- 2612:00 p.m. to 3:59 p.m.
- 404:00 p.m. to 11:59 p.m.

Occupations of males:
- Percentage of males in management occupations (except farmers):
Here: 6.9% city: 16.2%
- Percentage of males in business and financial operations occupations:
Here: 11.9% city: 7.0%
- Percentage of males in computer and mathematical occupations:
Here: 1.7% city: 6.1%
- Percentage of males in architecture and engineering occupations:
Here: 6.9% city: 4.7%
- Percentage of males in arts, design, entertainment, sports, and media occupations:
Here: 3.0% city: 3.3%
- Percentage of males in healthcare practitioners and technical occupations:
Here: 4.7% city: 3.8%
- Percentage of males in service occupations:
Here: 13.8% city: 16.0%
- Percentage of males in sales and office occupations:
Here: 9.7% city: 17.6%
- Percentage of males in construction, extraction, and maintenance occupations:
Here: 25.4% city: 3.9%
- Percentage of males in production occupations:
Here: 11.9% city: 3.7%
- Percentage of males in transportation occupations:
Here: 2.5% city: 4.1%
- Percentage of males in material moving occupations:
Here: 3.9% city: 2.0%
Occupations of females:
- Percentage of females in management occupations (except farmers):
Here: 1.4% city: 10.5%
- Percentage of females in business and financial operations occupations:
Here: 14.3% city: 9.0%
- Percentage of females in life, physical, and social science occupations:
Here: 3.6% city: 1.6%
- Percentage of females in education, training, and library occupations:
Here: 23.6% city: 9.4%
- Percentage of females in arts, design, entertainment, sports, and media occupations:
Here: 10.7% city: 1.6%
- Percentage of females in healthcare practitioners and technical occupations:
Here: 2.8% city: 13.2%
- Percentage of females in service occupations:
Here: 4.5% city: 14.8%
- Percentage of females in sales and office occupations:
Here: 35.1% city: 28.8%
- Percentage of females in production occupations:
Here: 3.1% city: 1.6%
- Percentage of females in transportation occupations:
Here: 1.4% city: 0.8%
- Percentage of females in material moving occupations:
Here: 2.1% city: 1.1%
Education in this neighborhood (subdivision or community):
- Percentage of people 3 years and older in K-12 schools:
Hilltop Circle: 15.5% Roseville: 16.1%
- Percentage of people 3 years and older in undergraduate colleges:
Hilltop Circle: 13.3% Roseville: 5.0%
- Percentage of people 3 years and older in grad. or professional schools:
Hilltop Circle: 0.3% Roseville: 0.7%
- Percentage of students K-12 enrolled in private schools:
Hilltop Circle: 9.8% Roseville: 6.8%
Percentage of population below poverty level:
| Hilltop Circle: | 20.2% |
| Roseville: | 5.6% |
Median year owner moved in (as recorded in 2022):
Median year renter moved in (as recorded in 2022):
| Hilltop Circle: | 2012 |
| Roseville: | 2013 |
Median year renter moved in (as recorded in 2022):
| Hilltop Circle: | 2016 |
| Roseville: | 2020 |
Percentage of married-couple families with both working:
| Hilltop Circle: | 66.7% |
| Roseville: | 69.0% |

- 60.8%Utility gas
- 33.2%Electricity
- 2.2%Bottled, tank, or LP gas
- 1.8%Fuel oil, kerosene, etc.
- 1.1%Wood
- 1.1%Solar energy
Roads and streets:
Hilltop Cir
Length: 0.66 miles
Directions: E-W, N-S, SE-NW, SW-NE
Address range: 2000 to 2099
Directions: E-W, N-S, SE-NW, SW-NE
Address range: 2000 to 2099
Pfe Rd
Length: 0.48 miles
Direction: E-W
Address range: 1700 to 1995
Direction: E-W
Address range: 1700 to 1995
March Rd
Length: 0.20 miles
Directions: N-S, SW-NE
Address range: 2100 to 2199
Directions: N-S, SW-NE
Address range: 2100 to 2199
Atkinson St
Length: 0.16 miles
Direction: SW-NE
Address range: 9400 to 9498
Direction: SW-NE
Address range: 9400 to 9498
Railroad features:
Union Pacific RR
Length: 3.05 miles
Directions: E-W, N-S, SW-NE
Directions: E-W, N-S, SW-NE
Other features:
Dry Crk
Length: 0.26 miles
Direction: E-W
Direction: E-W