Hillcrest neighborhood in Maplewood, New Jersey (NJ), 07040 detailed profile
Settings
X


Business Search - 14 Million verified businesses
Area: 0.057 square miles
Population: 1,265
Population density:
| Hillcrest: | 22,100 people per square mile |
| Maplewood: | 6,207 people per square mile |

- 53837.0%Hispanic or Latino
- 34123.4%Black
- 29120.0%White
- 1077.4%American Indian
- 906.2%Asian
- 644.4%Some other race
- 241.6%Two or more races

Median household income in 2022:
| Hillcrest: | $143,759 |
| New Jersey: | $96,346 |
Distribution of median household income
![Distribution of median household income]()
- 42Less than $10,000
- 58$10,000 to $19,999
- 21$20,000 to $29,999
- 133$30,000 to $39,999
- 104$40,000 to $49,999
- 27$50,000 to $59,999
- 15$60,000 to $74,999
- 38$75,000 to $99,999
- 83$100,000 to $124,999
- 37$125,000 to $149,999
- 75$150,000 to $199,999
- 46$200,000 or more

Distribution of owner-occupied house/condo value
![Distribution of owner-occupied house/condo value]()
- 79Less than $50,000
- 47$50,000 to $99,999
- 80$100,000 to $149,999
- 119$150,000 to $199,999
- 90$200,000 to $249,999
- 45$250,000 to $299,999
- 19$300,000 to $399,999
- 81$400,000 to $499,999
- 94$500,000 to $749,999
- 23$750,000 to $999,999
- 74$1,000,000 or more

Distribution of rent paid by renters
![Distribution of rent paid by renters]()
- 98$100 to $199
- 25$300 to $399
- 7$600 to $699
- 24$900 to $999
- 48$1,000 to $1,249
- 10$1,250 to $1,499
- 14$1,500 to $1,999
- 74$2,000 or more

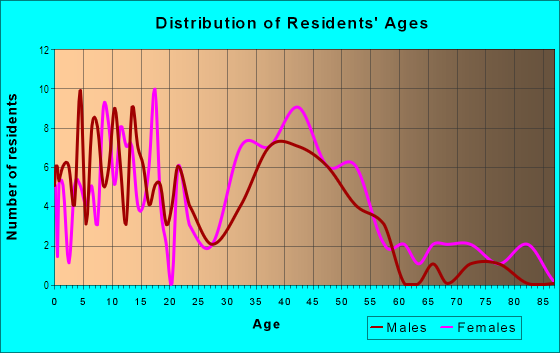
| Males: | 549 |
| Females: | 716 |
| Males: | 43.3 years |
| Females: | 52.1 years |
Average household size:
| Hillcrest: | 14.5 people |
| New Jersey: | 2.6 people |
Percentage of family households:
| Hillcrest: | 43.7% |
| New Jersey: | 47.0% |
| Here: | 46.8% |
| New Jersey: | 49.9% |
Percentage of married-couple families with children (among all households):
| Hillcrest: | 20.9% |
| New Jersey: | 51.5% |
Percentage of single-mother households (among all households):
| Hillcrest: | 5.5% |
| New Jersey: | 7.6% |
Percentage of never married males 15 years old and over:
Percentage of never married females 15 years old and over:
| Hillcrest: | 27.2% |
| New Jersey: | 18.2% |
Percentage of never married females 15 years old and over:
| Hillcrest: | 22.5% |
| New Jersey: | 16.6% |
Percentage of people that speak English not well or not at all:
| Hillcrest: | 11.4% |
| New Jersey: | 6.5% |
Percentage of people born in this state:
Percentage of people born in another U.S. state:
Percentage of native residents but born outside the U.S.:
Percentage of foreign born residents:
| Here: | 40.3% |
| New Jersey: | 50.7% |
Percentage of people born in another U.S. state:
| Hillcrest: | 27.4% |
| New Jersey: | 23.4% |
Percentage of native residents but born outside the U.S.:
| Here: | 9.1% |
| New Jersey: | 2.4% |
Percentage of foreign born residents:
| Here: | 23.3% |
| New Jersey: | 23.5% |

Owner-occupied
Renter-occupied


- Rooms in owner-occupied houses and condos in Hillcrest
- 611 room
- 02 rooms
- 113 rooms
- 174 rooms
- 325 rooms
- 896 rooms
- 717 rooms
- 1048 rooms
- 549+ rooms

- Rooms in renter-occupied apartments in Hillcrest
- 71 room
- 122 rooms
- 183 rooms
- 114 rooms
- 475 rooms
- 296 rooms
- 107 rooms
- 228 rooms
- 109+ rooms
Owner-occupied
Renter-occupied

- Bedrooms in owner-occupied houses and condos in Hillcrest
- 17no bedroom
- 151 bedroom
- 352 bedrooms
- 1993 bedrooms
- 824 bedrooms
- 1475+ bedrooms

- Bedrooms in renter-occupied apartments in Hillcrest
- 7no bedroom
- 231 bedroom
- 252 bedrooms
- 213 bedrooms
- 114 bedrooms
- 335+ bedrooms
Average number of cars or other vehicles available in houses/condos:
Average number of cars or other vehicles available in apartments:
| This neighborhood: | 1.5 |
| New Jersey: | 2.0 |
Average number of cars or other vehicles available in apartments:
| Here: | |
| New Jersey: |
Percentage of units with a mortgage:
| Hillcrest: | 62.0% |
| New Jersey: | 63.3% |
Housing prices:
- Average estimated value of detached houses in 2022 (65.7% of all units):
Hillcrest: $146,460 New Jersey: $537,591
- Average estimated value of townhouses or other attached units in 2022 (22.6% of all units):
This neighborhood: $1,334,318 New Jersey: $381,113

- Year house built in Hillcrest
- 42020 or later
- 42010 to 2019
- 212000 to 2009
- 91990 to 1999
- 201980 to 1989
- 331970 to 1979
- 431960 to 1969
- 721950 to 1959
- 511940 to 1949
- 1991939 or earlier

City-data.com crime index for place in 2020 (higher means more crime):
| City: | 77.7 |
| U.S. average: | 219.5 |
Travel time to work (commute)
![Travel time to work (commute)]()
- 1Less than 5 minutes
- 435 to 9 minutes
- 8010 to 14 minutes
- 5515 to 19 minutes
- 8620 to 24 minutes
- 3525 to 29 minutes
- 9330 to 34 minutes
- 1935 to 39 minutes
- 1240 to 44 minutes
- 4345 to 59 minutes
- 3160 to 89 minutes
- 2090 or more minutes

Means of transportation to work
![Means of transportation to work]()
- 68.2%446Drove a car alone
- 16.4%107Carpooled
- 17.3%113Bus
- 1.7%11Subway or elevated rail
- 13.3%87Long-distance train or commuter rail
- 0.2%1Light rail, streetcar or trolley
- 1.1%7Taxi
- 0.2%1Bicycle
- 4.4%29Walked
- 7.6%50Other means
- 8.9%58Worked at home

Time leaving home to go to work
![Time leaving home to go to work]()
- 2612:00 a.m. to 4:59 a.m.
- 195:00 a.m. to 5:29 a.m.
- 245:30 a.m. to 5:59 a.m.
- 276:00 a.m. to 6:29 a.m.
- 366:30 a.m. to 6:59 a.m.
- 637:00 a.m. to 7:29 a.m.
- 417:30 a.m. to 7:59 a.m.
- 718:00 a.m. to 8:29 a.m.
- 258:30 a.m. to 8:59 a.m.
- 369:00 a.m. to 9:59 a.m.
- 810:00 a.m. to 10:59 a.m.
- 1511:00 a.m. to 11:59 a.m.
- 5812:00 p.m. to 3:59 p.m.
- 554:00 p.m. to 11:59 p.m.

Occupations of males:
- Percentage of males in management occupations (except farmers):
Here: 9.7% New Jersey: 13.9%
- Percentage of males in business and financial operations occupations:
Here: 6.1% New Jersey: 6.9%
- Percentage of males in architecture and engineering occupations:
Here: 1.3% New Jersey: 3.1%
- Percentage of males in legal occupations:
Here: 1.6% New Jersey: 1.5%
- Percentage of males in education, training, and library occupations:
Here: 3.9% New Jersey: 3.6%
- Percentage of males in service occupations:
Here: 19.7% New Jersey: 12.9%
- Percentage of males in sales and office occupations:
Here: 11.0% New Jersey: 15.3%
- Percentage of males in construction, extraction, and maintenance occupations:
Here: 15.7% New Jersey: 8.1%
- Percentage of males in production occupations:
Here: 16.0% New Jersey: 4.8%
- Percentage of males in transportation occupations:
Here: 6.2% New Jersey: 6.5%
- Percentage of males in material moving occupations:
Here: 2.9% New Jersey: 4.7%
Occupations of females:
- Percentage of females in management occupations (except farmers):
Here: 25.4% New Jersey: 10.4%
- Percentage of females in business and financial operations occupations:
Here: 8.4% New Jersey: 7.3%
- Percentage of females in computer and mathematical occupations:
Here: 6.4% New Jersey: 2.4%
- Percentage of females in life, physical, and social science occupations:
Here: 2.0% New Jersey: 1.4%
- Percentage of females in community and social services occupations:
Here: 2.3% New Jersey: 2.6%
- Percentage of females in education, training, and library occupations:
Here: 3.9% New Jersey: 11.4%
- Percentage of females in arts, design, entertainment, sports, and media occupations:
Here: 1.3% New Jersey: 2.2%
- Percentage of females in healthcare practitioners and technical occupations:
Here: 7.7% New Jersey: 9.6%
- Percentage of females in service occupations:
Here: 10.3% New Jersey: 17.2%
- Percentage of females in sales and office occupations:
Here: 16.6% New Jersey: 26.7%
- Percentage of females in production occupations:
Here: 4.1% New Jersey: 2.7%
- Percentage of females in transportation occupations:
Here: 4.3% New Jersey: 1.2%
- Percentage of females in material moving occupations:
Here: 7.0% New Jersey: 2.4%
Percentage of people 16-64 in Armed Forces:
| Hillcrest: | 0.3% |
| New Jersey: | 0.2% |
Education in this neighborhood (subdivision or community):
- Percentage of people 3 years and older in K-12 schools:
Hillcrest: 38.8% New Jersey: 16.6%
- Percentage of people 3 years and older in undergraduate colleges:
Hillcrest: 5.7% New Jersey: 4.9%
- Percentage of people 3 years and older in grad. or professional schools:
Hillcrest: 6.2% New Jersey: 1.6%
- Percentage of students K-12 enrolled in private schools:
Hillcrest: 15.5% New Jersey: 12.7%
Percentage of population below poverty level:
| Hillcrest: | 12.6% |
| New Jersey: | 9.7% |
Median year owner moved in (as recorded in 2022):
| Hillcrest: | 2416 |
| New Jersey: | 2008 |
Percentage of married-couple families with both working:
| Hillcrest: | 151.5% |
| New Jersey: | 72.0% |

- 65.4%Utility gas
- 14.3%Fuel oil, kerosene, etc.
- 8.5%Electricity
- 5.3%Bottled, tank, or LP gas
- 4.4%Other fuel
- 2.0%No fuel used
Roads and streets:
Parker Ave
Length: 0.40 miles
Direction: E-W
Address range: 200 to 300
Direction: E-W
Address range: 200 to 300
Hillcrest Rd
Length: 0.34 miles
Direction: E-W
Address range: 1 to 112
Direction: E-W
Address range: 1 to 112
Boyden Ave
Length: 0.18 miles
Direction: SW-NE
Address range: 11 to 44
Direction: SW-NE
Address range: 11 to 44
Irvington Ave
Length: 0.16 miles
Direction: N-S
Address range: 692 to 777
Direction: N-S
Address range: 692 to 777
William St
Length: 0.14 miles
Direction: E-W
Address range: 1 to 38
Direction: E-W
Address range: 1 to 38
Orchard Rd
Length: 0.12 miles
Direction: N-S
Address range: 96 to 141
Direction: N-S
Address range: 96 to 141
Fernwood Rd
Length: 0.11 miles
Direction: N-S
Address range: 37 to 79
Direction: N-S
Address range: 37 to 79
Peachtree Rd
Length: 0.09 miles
Direction: N-S
Address range: 41 to 78
Direction: N-S
Address range: 41 to 78
Cherry Pl
Length: 0.08 miles
Direction: N-S
Address range: 1 to 33
Direction: N-S
Address range: 1 to 33
Essex County 665
Length: 0.01 miles
Direction: SE-NW
Direction: SE-NW