Heritage Valley (Heritage Valley Parks) neighborhood in Fillmore, California (CA), 93015 detailed profile
Settings
X


Business Search - 14 Million verified businesses
Area: 0.786 square miles
Population: 89
Population density:
| Heritage Valley (Heritage Valley Parks): | 113 people per square mile |
| Fillmore: | 5,923 people per square mile |

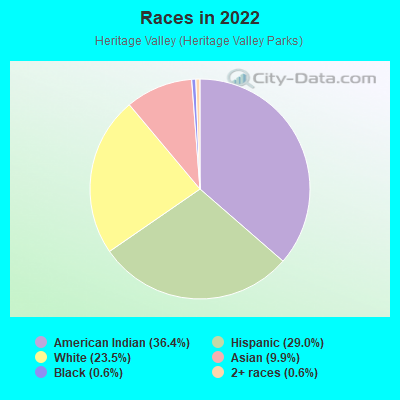
- 5936.4%American Indian
- 4729.0%Hispanic or Latino
- 3823.5%White
- 169.9%Asian
- 10.6%Black
- 10.6%Two or more races
Median household income in 2022:
| Heritage Valley (Heritage Valley Parks): | $85,903 |
| Fillmore: | $85,255 |
Distribution of median household income
![Distribution of median household income]()
- 62Less than $10,000
- 7$10,000 to $19,999
- 9$20,000 to $29,999
- 4$30,000 to $39,999
- 5$40,000 to $49,999
- 3$50,000 to $59,999
- 10$60,000 to $74,999
- 3$75,000 to $99,999
- 5$100,000 to $124,999
- 8$125,000 to $149,999
- 4$150,000 to $199,999
- 22$200,000 or more

Distribution of owner-occupied house/condo value
![Distribution of owner-occupied house/condo value]()
- 2Less than $50,000
- 95$50,000 to $99,999
- 4$100,000 to $149,999
- 2$150,000 to $199,999
- 5$200,000 to $249,999
- 193$300,000 to $399,999
- 2$400,000 to $499,999
- 12$500,000 to $749,999
- 2$750,000 to $999,999
- 120$1,000,000 or more

Distribution of rent paid by renters
![Distribution of rent paid by renters]()
- 1$200 to $299
- 120$500 to $599
- 2$700 to $799
- 3$800 to $899
- 1$900 to $999
- 5$1,000 to $1,249
- 4$1,250 to $1,499
- 8$1,500 to $1,999
- 25$2,000 or more

Median rent in 2022:
| Heritage Valley (Heritage Valley Parks): | $1,548 |
| Fillmore: | $1,721 |
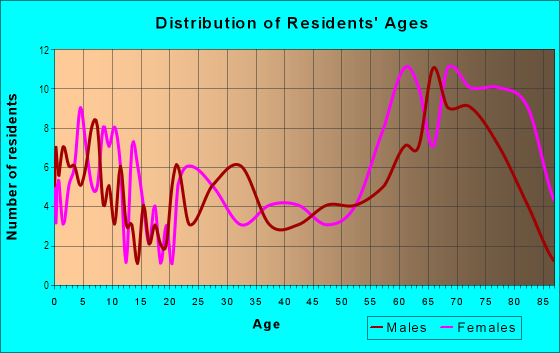
| Males: | 54 |
| Females: | 35 |
Males:
| This neighborhood: | 46.5 years |
| Whole city: | 35.3 years |
| This neighborhood: | 29.6 years |
| Whole city: | 34.6 years |
Average household size:
| Heritage Valley (Heritage Valley Parks): | 2.7 people |
| Fillmore: | 3.3 people |
Percentage of family households:
| Heritage Valley (Heritage Valley Parks): | 42.3% |
| Fillmore: | 60.4% |
| Here: | 27.9% |
| Fillmore: | 53.1% |
Percentage of married-couple families with children (among all households):
| Heritage Valley (Heritage Valley Parks): | 19.2% |
| Fillmore: | 22.7% |
Percentage of single-mother households (among all households):
| Heritage Valley (Heritage Valley Parks): | 27.0% |
| Fillmore: | 5.9% |
Percentage of never married males 15 years old and over:
Percentage of never married females 15 years old and over:
| Heritage Valley (Heritage Valley Parks): | 15.5% |
| Fillmore: | 20.0% |
Percentage of never married females 15 years old and over:
| Heritage Valley (Heritage Valley Parks): | 16.2% |
| city: | 17.2% |
Percentage of people that speak English not well or not at all:
| Heritage Valley (Heritage Valley Parks): | 8.0% |
| Fillmore: | 9.6% |
Percentage of people born in this state:
Percentage of people born in another U.S. state:
Percentage of native residents but born outside the U.S.:
Percentage of foreign born residents:
| Here: | 72.6% |
| Fillmore: | 73.9% |
Percentage of people born in another U.S. state:
| Heritage Valley (Heritage Valley Parks): | 8.2% |
| Fillmore: | 6.1% |
Percentage of native residents but born outside the U.S.:
| Here: | 0.6% |
| city: | 0.8% |
Percentage of foreign born residents:
| Here: | 18.7% |
| Fillmore: | 19.2% |
Owner-occupied
Renter-occupied

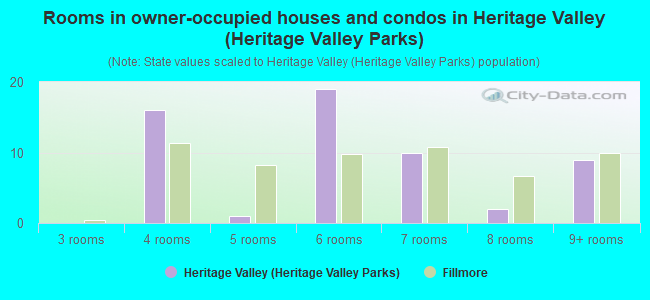
- Rooms in owner-occupied houses and condos in Heritage Valley <
> - 01 room
- 02 rooms
- 03 rooms
- 164 rooms
- 15 rooms
- 196 rooms
- 107 rooms
- 28 rooms
- 99+ rooms

- Rooms in renter-occupied apartments in Heritage Valley <
> - 21 room
- 12 rooms
- 33 rooms
- 74 rooms
- 75 rooms
- 3326 rooms
- 17 rooms
- 1198 rooms
- 09+ rooms
Owner-occupied
Renter-occupied
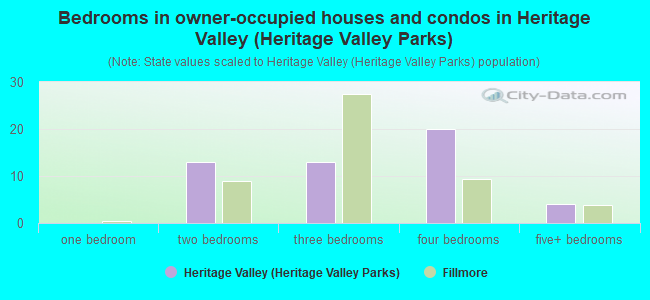
- Bedrooms in owner-occupied houses and condos in Heritage Valley <
> - 0no bedroom
- 01 bedroom
- 132 bedrooms
- 133 bedrooms
- 204 bedrooms
- 45+ bedrooms
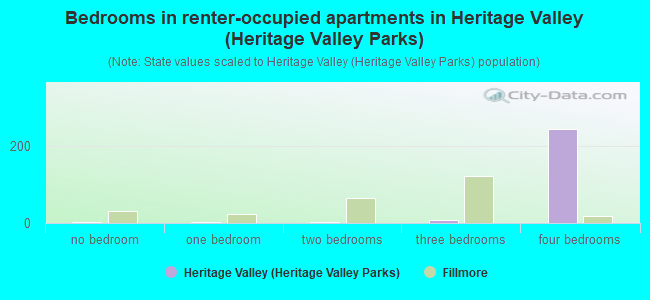
- Bedrooms in renter-occupied apartments in Heritage Valley <
> - 2no bedroom
- 31 bedroom
- 32 bedrooms
- 73 bedrooms
- 2454 bedrooms
- 05+ bedrooms
Average number of cars or other vehicles available in houses/condos:
Average number of cars or other vehicles available in apartments:
| This neighborhood: | 2.7 |
| Fillmore: | 2.5 |
Average number of cars or other vehicles available in apartments:
| Here: | 1.7 |
| city: | 1.7 |
Percentage of units with a mortgage:
| Heritage Valley (Heritage Valley Parks): | 25.2% |
| Fillmore: | 64.0% |
Average estimated value of detached houses in 2022 (76.5% of all units):
| Heritage Valley (Heritage Valley Parks): | $582,119 |
| California: | $988,808 |
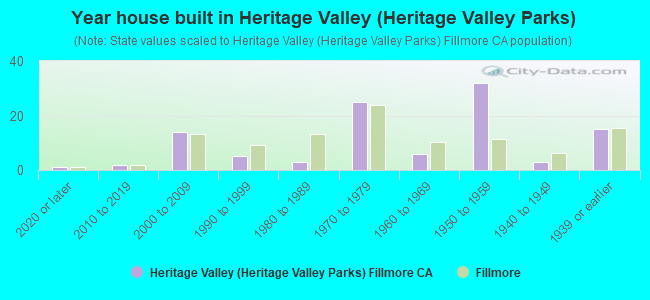
- Year house built in Heritage Valley <
> - 12020 or later
- 22010 to 2019
- 142000 to 2009
- 51990 to 1999
- 31980 to 1989
- 251970 to 1979
- 61960 to 1969
- 321950 to 1959
- 31940 to 1949
- 151939 or earlier

City-data.com crime index for city in 2020 (higher means more crime):
| City: | 105.8 |
| U.S. average: | 219.5 |
Travel time to work (commute)
![Travel time to work (commute)]()
- 8Less than 5 minutes
- 55 to 9 minutes
- 1110 to 14 minutes
- 515 to 19 minutes
- 620 to 24 minutes
- 625 to 29 minutes
- 1330 to 34 minutes
- 335 to 39 minutes
- 540 to 44 minutes
- 4745 to 59 minutes
- 760 to 89 minutes
- 590 or more minutes

Means of transportation to work
![Means of transportation to work]()
- 68.2%34Drove a car alone
- 18.1%9Carpooled
- 206.7%103Bus
- 40.1%20Bicycle
- 192.7%96Walked
- 2.0%1Other means
- 6.0%3Worked at home

Time leaving home to go to work
![Time leaving home to go to work]()
- 612:00 a.m. to 4:59 a.m.
- 15:00 a.m. to 5:29 a.m.
- 135:30 a.m. to 5:59 a.m.
- 26:00 a.m. to 6:29 a.m.
- 76:30 a.m. to 6:59 a.m.
- 117:00 a.m. to 7:29 a.m.
- 97:30 a.m. to 7:59 a.m.
- 88:00 a.m. to 8:29 a.m.
- 28:30 a.m. to 8:59 a.m.
- 79:00 a.m. to 9:59 a.m.
- 411:00 a.m. to 11:59 a.m.
- 712:00 p.m. to 3:59 p.m.
- 84:00 p.m. to 11:59 p.m.

Occupations of males:
- Percentage of males in management occupations (except farmers):
Here: 13.0% city: 10.4%
- Percentage of males in architecture and engineering occupations:
Here: 5.1% city: 3.2%
- Percentage of males in arts, design, entertainment, sports, and media occupations:
Here: 2.4% city: 0.4%
- Percentage of males in service occupations:
Here: 5.2% city: 18.9%
- Percentage of males in sales and office occupations:
Here: 14.0% city: 14.8%
- Percentage of males in farming, fishing, and forestry occupations:
Here: 30.9% city: 9.6%
- Percentage of males in construction, extraction, and maintenance occupations:
Here: 2.3% city: 8.0%
- Percentage of males in production occupations:
Here: 17.7% city: 8.9%
- Percentage of males in transportation occupations:
Here: 3.0% city: 3.2%
- Percentage of males in material moving occupations:
Here: 1.2% city: 6.1%
Occupations of females:
- Percentage of females in management occupations (except farmers):
Here: 4.0% city: 6.8%
- Percentage of females in business and financial operations occupations:
Here: 4.1% city: 4.6%
- Percentage of females in architecture and engineering occupations:
Here: 12.4% city: 2.5%
- Percentage of females in community and social services occupations:
Here: 4.0% city: 5.0%
- Percentage of females in education, training, and library occupations:
Here: 2.5% city: 3.9%
- Percentage of females in healthcare practitioners and technical occupations:
Here: 14.7% city: 11.6%
- Percentage of females in service occupations:
Here: 17.5% city: 21.3%
- Percentage of females in sales and office occupations:
Here: 18.9% city: 29.7%
- Percentage of females in farming, fishing, and forestry occupations:
Here: 22.9% city: 4.5%
- Percentage of females in production occupations:
Here: 3.1% city: 3.4%
- Percentage of females in transportation occupations:
Here: 6.9% city: 1.2%
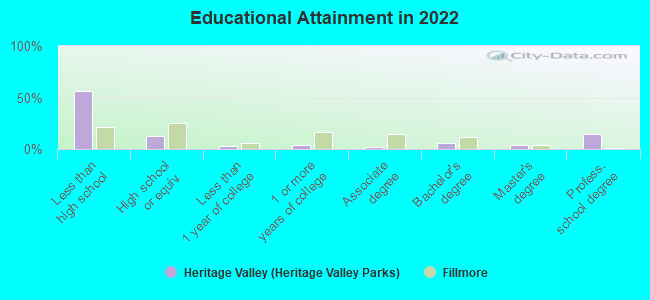
Education in this neighborhood (subdivision or community):
- Percentage of people 3 years and older in K-12 schools:
Heritage Valley (Heritage Valley Parks): 47.2% Fillmore: 20.8%
- Percentage of people 3 years and older in undergraduate colleges:
Heritage Valley (Heritage Valley Parks): 9.0% Fillmore: 8.0%
- Percentage of people 3 years and older in grad. or professional schools:
Heritage Valley (Heritage Valley Parks): 0.0% Fillmore: 0.0%
- Percentage of students K-12 enrolled in private schools:
Heritage Valley (Heritage Valley Parks): 50.0% Fillmore: 10.8%
Percentage of population below poverty level:
| Heritage Valley (Heritage Valley Parks): | 8.1% |
| Fillmore: | 6.8% |
Median year owner moved in (as recorded in 2022):
Median year renter moved in (as recorded in 2022):
| Heritage Valley (Heritage Valley Parks): | 1998 |
| Fillmore: | 2006 |
Median year renter moved in (as recorded in 2022):
| Heritage Valley (Heritage Valley Parks): | 2010 |
| Fillmore: | 2013 |
Percentage of married-couple families with both working:
| Heritage Valley (Heritage Valley Parks): | 711.1% |
| Fillmore: | 59.6% |
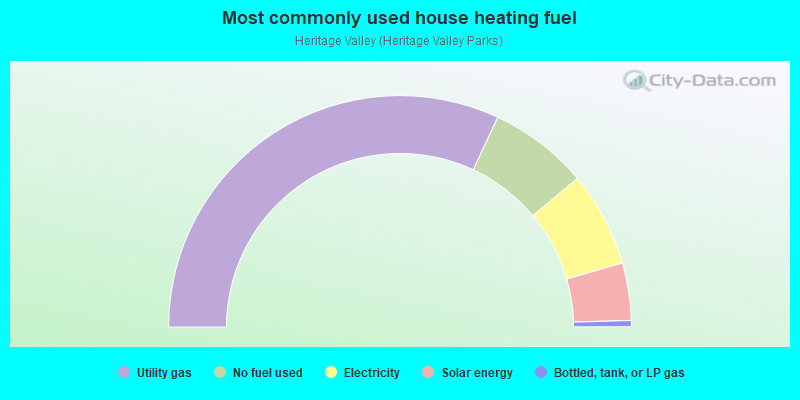
- 63.9%Utility gas
- 13.9%No fuel used
- 13.3%Electricity
- 8.0%Solar energy
- 0.9%Bottled, tank, or LP gas
Highways in this neighborhood:
State Rte 126 (E Telegraph Rd)
Length: 2.69 miles
Direction: E-W
Address range: 1 to 849
Direction: E-W
Address range: 1 to 849
State Rte 126 (W Telegraph Rd)
Length: 1.33 miles
Direction: E-W
Address range: 100 to 499
Direction: E-W
Address range: 100 to 499
Roads and streets:
Santa Clara Ave (Santa Clara St)
Length: 0.73 miles
Directions: E-W, N-S, SE-NW, SW-NE
Address range: 100 to 499
Directions: E-W, N-S, SE-NW, SW-NE
Address range: 100 to 499
River St
Length: 0.69 miles
Directions: E-W, N-S
Address range: 400 to 499
Directions: E-W, N-S
Address range: 400 to 499
Central Ave
Length: 0.39 miles
Directions: N-S, SE-NW, SW-NE
Address range: 100 to 267
Directions: N-S, SE-NW, SW-NE
Address range: 100 to 267
Mountain View St
Length: 0.36 miles
Direction: N-S
Address range: 200 to 235
Direction: N-S
Address range: 200 to 235
Kellogg St
Length: 0.33 miles
Directions: N-S, SE-NW
Address range: 1 to 199
Directions: N-S, SE-NW
Address range: 1 to 199
Bridlewood Ln
Length: 0.20 miles
Directions: E-W, N-S, SW-NE
Address range: 100 to 499
Directions: E-W, N-S, SW-NE
Address range: 100 to 499
Sespe Land and Water
Length: 0.16 miles
Direction: N-S
Direction: N-S
Fish Hatchery Rd
Length: 0.14 miles
Direction: N-S
Direction: N-S
Wildwood
Length: 0.14 miles
Directions: E-W, N-S
Directions: E-W, N-S
Fillmore St
Length: 0.10 miles
Direction: N-S
Address range: 200 to 299
Direction: N-S
Address range: 200 to 299
Saratoga St
Length: 0.10 miles
Direction: N-S
Address range: 200 to 299
Direction: N-S
Address range: 200 to 299
Clay St
Length: 0.10 miles
Direction: N-S
Address range: 200 to 299
Direction: N-S
Address range: 200 to 299
Palm
Length: 0.06 miles
Directions: E-W, N-S, SE-NW, SW-NE
Directions: E-W, N-S, SE-NW, SW-NE
Sandalwood Pl
Length: 0.05 miles
Direction: N-S
Address range: 100 to 199
Direction: N-S
Address range: 100 to 199
el Dorado Dr
Length: 0.04 miles
Direction: N-S
Direction: N-S
Railroad features:
Union Pacific RR
Length: 0.70 miles
Directions: E-W, SE-NW
Directions: E-W, SE-NW
Other features:
Pole Crk
Length: 0.35 miles
Directions: N-S, SE-NW
Directions: N-S, SE-NW