Harding neighborhood in Roseville, California (CA), 95678 detailed profile
Settings
X


Business Search - 14 Million verified businesses
Area: 1.216 square miles
Population: 853
Population density:
| Harding: | 701 people per square mile |
| Roseville: | 5,080 people per square mile |

- 44752.6%White
- 16819.8%Hispanic or Latino
- 9611.3%Two or more races
- 627.3%Black
- 374.4%Asian
- 263.1%American Indian
- 141.6%Some other race

Median household income in 2022:
| Harding: | $105,110 |
| Roseville: | $100,739 |
Distribution of median household income
![Distribution of median household income]()
- 60Less than $10,000
- 16$10,000 to $19,999
- 29$20,000 to $29,999
- 30$30,000 to $39,999
- 17$40,000 to $49,999
- 28$50,000 to $59,999
- 167$60,000 to $74,999
- 78$75,000 to $99,999
- 53$100,000 to $124,999
- 60$125,000 to $149,999
- 58$150,000 to $199,999
- 13$200,000 or more

Distribution of owner-occupied house/condo value
![Distribution of owner-occupied house/condo value]()
- 18Less than $50,000
- 9$50,000 to $99,999
- 6$150,000 to $199,999
- 15$200,000 to $249,999
- 167$300,000 to $399,999
- 343$400,000 to $499,999
- 799$500,000 to $749,999
- 59$750,000 to $999,999
- 11$1,000,000 or more

Distribution of rent paid by renters
![Distribution of rent paid by renters]()
- 4$300 to $399
- 3$800 to $899
- 6$900 to $999
- 4$1,000 to $1,249
- 12$1,250 to $1,499
- 146$1,500 to $1,999
- 258$2,000 or more

Median rent in 2022:
| Harding: | $2,137 |
| Roseville: | $1,946 |
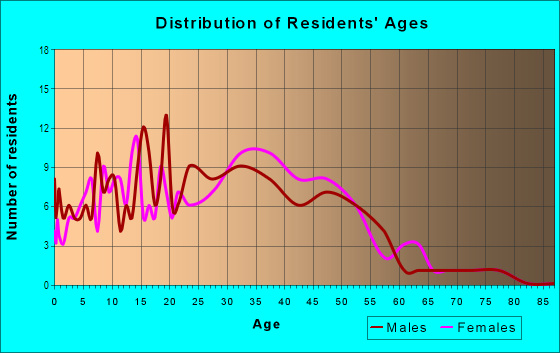
| Males: | 439 |
| Females: | 413 |
Males:
| This neighborhood: | 38.4 years |
| Whole city: | 39.8 years |
| This neighborhood: | 45.0 years |
| Whole city: | 45.1 years |
Average household size:
| Harding: | 2.2 people |
| Roseville: | 2.5 people |
Percentage of family households:
| Harding: | 44.0% |
| Roseville: | 46.4% |
| Here: | 27.0% |
| Roseville: | 52.5% |
Percentage of married-couple families with children (among all households):
| Harding: | 31.1% |
| Roseville: | 31.8% |
Percentage of single-mother households (among all households):
| Harding: | 14.2% |
| Roseville: | 4.7% |
Percentage of never married males 15 years old and over:
Percentage of never married females 15 years old and over:
| Harding: | 17.2% |
| Roseville: | 16.5% |
Percentage of never married females 15 years old and over:
| Harding: | 19.0% |
| city: | 11.4% |
Percentage of people that speak English not well or not at all:
| Harding: | 1.2% |
| Roseville: | 2.1% |
Percentage of people born in this state:
Percentage of people born in another U.S. state:
Percentage of native residents but born outside the U.S.:
Percentage of foreign born residents:
| Here: | 65.7% |
| Roseville: | 61.6% |
Percentage of people born in another U.S. state:
| Harding: | 20.7% |
| Roseville: | 20.5% |
Percentage of native residents but born outside the U.S.:
| Here: | 1.2% |
| city: | 2.8% |
Percentage of foreign born residents:
| Here: | 12.4% |
| Roseville: | 15.0% |

Owner-occupied
Renter-occupied


- Rooms in owner-occupied houses and condos in Harding
- 01 room
- 02 rooms
- 53 rooms
- 644 rooms
- 3105 rooms
- 2306 rooms
- 3647 rooms
- 2838 rooms
- 1129+ rooms

- Rooms in renter-occupied apartments in Harding
- 311 room
- 122 rooms
- 873 rooms
- 2164 rooms
- 135 rooms
- 306 rooms
- 07 rooms
- 48 rooms
- 109+ rooms
Owner-occupied
Renter-occupied

- Bedrooms in owner-occupied houses and condos in Harding
- 0no bedroom
- 141 bedroom
- 742 bedrooms
- 6103 bedrooms
- 6264 bedrooms
- 535+ bedrooms

- Bedrooms in renter-occupied apartments in Harding
- 31no bedroom
- 601 bedroom
- 3002 bedrooms
- 6373 bedrooms
- 54 bedrooms
- 105+ bedrooms
Average number of cars or other vehicles available in houses/condos:
Average number of cars or other vehicles available in apartments:
| This neighborhood: | |
| Roseville: |
Average number of cars or other vehicles available in apartments:
| Here: | 1.5 |
| city: | 1.5 |
Percentage of units with a mortgage:
| Harding: | 47.5% |
| Roseville: | 72.1% |

- Year house built in Harding
- 02020 or later
- 1022010 to 2019
- 1472000 to 2009
- 1241990 to 1999
- 111980 to 1989
- 161970 to 1979
- 361960 to 1969
- 501950 to 1959
- 961940 to 1949
- 2781939 or earlier

City-data.com crime index for city in 2020 (higher means more crime):
| City: | 150.3 |
| U.S. average: | 219.5 |
Travel time to work (commute)
![Travel time to work (commute)]()
- 8Less than 5 minutes
- 1875 to 9 minutes
- 18510 to 14 minutes
- 8115 to 19 minutes
- 3220 to 24 minutes
- 5525 to 29 minutes
- 7130 to 34 minutes
- 3935 to 39 minutes
- 4940 to 44 minutes
- 1245 to 59 minutes
- 2360 to 89 minutes
- 3390 or more minutes

Means of transportation to work
![Means of transportation to work]()
- 87.2%431Drove a car alone
- 10.7%53Carpooled
- 0.4%2Bus
- 4.7%23Long-distance train or commuter rail
- 3.8%19Motorcycle
- 26.9%133Bicycle
- 6.5%32Walked
- 2.0%10Other means
- 5.7%28Worked at home

Time leaving home to go to work
![Time leaving home to go to work]()
- 5312:00 a.m. to 4:59 a.m.
- 235:00 a.m. to 5:29 a.m.
- 295:30 a.m. to 5:59 a.m.
- 406:00 a.m. to 6:29 a.m.
- 586:30 a.m. to 6:59 a.m.
- 1717:00 a.m. to 7:29 a.m.
- 1387:30 a.m. to 7:59 a.m.
- 538:00 a.m. to 8:29 a.m.
- 618:30 a.m. to 8:59 a.m.
- 189:00 a.m. to 9:59 a.m.
- 2410:00 a.m. to 10:59 a.m.
- 3011:00 a.m. to 11:59 a.m.
- 1712:00 p.m. to 3:59 p.m.
- 994:00 p.m. to 11:59 p.m.

Occupations of males:
- Percentage of males in management occupations (except farmers):
Here: 7.4% city: 16.2%
- Percentage of males in business and financial operations occupations:
Here: 7.4% city: 7.0%
- Percentage of males in computer and mathematical occupations:
Here: 5.2% city: 6.1%
- Percentage of males in architecture and engineering occupations:
Here: 5.2% city: 4.7%
- Percentage of males in life, physical, and social science occupations:
Here: 2.1% city: 1.3%
- Percentage of males in community and social services occupations:
Here: 1.9% city: 1.2%
- Percentage of males in legal occupations:
Here: 2.0% city: 0.8%
- Percentage of males in education, training, and library occupations:
Here: 3.3% city: 3.2%
- Percentage of males in healthcare practitioners and technical occupations:
Here: 24.9% city: 3.8%
- Percentage of males in sales and office occupations:
Here: 34.1% city: 17.6%
- Percentage of males in production occupations:
Here: 9.9% city: 3.7%
- Percentage of males in transportation occupations:
Here: 23.2% city: 4.1%
- Percentage of males in material moving occupations:
Here: 3.0% city: 2.0%
Occupations of females:
- Percentage of females in business and financial operations occupations:
Here: 4.8% city: 9.0%
- Percentage of females in architecture and engineering occupations:
Here: 5.3% city: 0.9%
- Percentage of females in life, physical, and social science occupations:
Here: 9.7% city: 1.6%
- Percentage of females in legal occupations:
Here: 22.2% city: 1.3%
- Percentage of females in education, training, and library occupations:
Here: 4.3% city: 9.4%
- Percentage of females in arts, design, entertainment, sports, and media occupations:
Here: 1.8% city: 1.6%
- Percentage of females in healthcare practitioners and technical occupations:
Here: 11.2% city: 13.2%
- Percentage of females in service occupations:
Here: 16.9% city: 14.8%
- Percentage of females in sales and office occupations:
Here: 35.2% city: 28.8%
Percentage of people 16-64 in Armed Forces:
| Harding: | 0.9% |
| Roseville: | 0.4% |
Education in this neighborhood (subdivision or community):
- Percentage of people 3 years and older in K-12 schools:
Harding: 38.5% Roseville: 16.1%
- Percentage of people 3 years and older in undergraduate colleges:
Harding: 14.6% Roseville: 5.0%
- Percentage of people 3 years and older in grad. or professional schools:
Harding: 1.6% Roseville: 0.7%
- Percentage of students K-12 enrolled in private schools:
Harding: 37.7% Roseville: 6.8%
Percentage of population below poverty level:
| Harding: | 5.8% |
| Roseville: | 5.6% |
Median year renter moved in (as recorded in 2022):
| Harding: | 2019 |
| Roseville: | 2020 |
Percentage of married-couple families with both working:
| Harding: | 163.6% |
| Roseville: | 69.0% |

- 42.1%Utility gas
- 37.5%Electricity
- 14.1%Bottled, tank, or LP gas
- 6.2%No fuel used
Roads and streets:
Roseville Pkwy
Length: 1.52 miles
Directions: E-W, SE-NW
Directions: E-W, SE-NW
Gibson Dr
Length: 0.96 miles
Directions: E-W, N-S, SE-NW, SW-NE
Directions: E-W, N-S, SE-NW, SW-NE
Harding Blvd (N Harding Blvd)
Length: 0.70 miles
Direction: N-S
Address range: 700 to 799
Direction: N-S
Address range: 700 to 799
Reserve Dr
Length: 0.50 miles
Directions: N-S, SE-NW, SW-NE
Directions: N-S, SE-NW, SW-NE
Antelope Creek Dr
Length: 0.19 miles
Directions: E-W, N-S, SE-NW
Directions: E-W, N-S, SE-NW
Lilja Ct
Length: 0.16 miles
Directions: E-W, N-S
Directions: E-W, N-S
Trehowell Dr
Length: 0.15 miles
Direction: SE-NW
Direction: SE-NW
Keely Dr
Length: 0.13 miles
Directions: E-W, SE-NW, SW-NE
Directions: E-W, SE-NW, SW-NE
Castaic Dr
Length: 0.11 miles
Directions: E-W, SW-NE
Directions: E-W, SW-NE
Coibion Ct
Length: 0.11 miles
Direction: N-S
Direction: N-S
Lily Cross Dr (Lilly Cross Dr)
Length: 0.10 miles
Direction: E-W
Address range: 664 to 699
Direction: E-W
Address range: 664 to 699
Diamond Oaks Rd
Length: 0.05 miles
Direction: E-W
Direction: E-W
Berry St
Length: 0.03 miles
Directions: E-W, SW-NE
Address range: 800 to 999
Directions: E-W, SW-NE
Address range: 800 to 999
Prancer Ct
Length: 0.03 miles
Direction: SE-NW
Direction: SE-NW
Capitola Ct
Length: 0.03 miles
Directions: E-W, SW-NE
Directions: E-W, SW-NE
Railroad features:
Union Pacific RR
Length: 0.61 miles
Directions: E-W, SW-NE
Directions: E-W, SW-NE
Other features:
Antelope Crk
Length: 1.49 miles
Directions: E-W, N-S, SE-NW, SW-NE
Directions: E-W, N-S, SE-NW, SW-NE