Hanover Place neighborhood in Kansas City, Missouri (MO), 64111 detailed profile
Settings
X


Business Search - 14 Million verified businesses
Area: 0.248 square miles
Population: 1,978
Population density:
| Hanover Place: | 7,977 people per square mile |
| Kansas City: | 1,624 people per square mile |

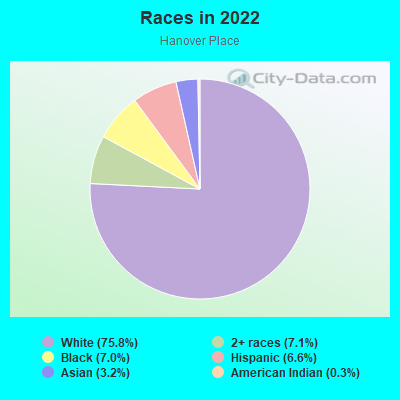
- 1,49775.8%White
- 1417.1%Two or more races
- 1387.0%Black
- 1306.6%Hispanic or Latino
- 633.2%Asian
- 60.3%American Indian
Median household income in 2022:
| Hanover Place: | $129,605 |
| Kansas City: | $62,175 |
Distribution of median household income
![Distribution of median household income]()
- 82Less than $10,000
- 48$10,000 to $19,999
- 70$20,000 to $29,999
- 52$30,000 to $39,999
- 189$40,000 to $49,999
- 112$50,000 to $59,999
- 121$60,000 to $74,999
- 170$75,000 to $99,999
- 50$100,000 to $124,999
- 60$125,000 to $149,999
- 24$150,000 to $199,999
- 120$200,000 or more

Distribution of owner-occupied house/condo value
![Distribution of owner-occupied house/condo value]()
- 61$100,000 to $149,999
- 27$200,000 to $249,999
- 44$250,000 to $299,999
- 56$300,000 to $399,999
- 94$400,000 to $499,999
- 89$500,000 to $749,999
- 72$750,000 to $999,999
- 13$1,000,000 or more

Distribution of rent paid by renters
![Distribution of rent paid by renters]()
- 16$400 to $499
- 10$500 to $599
- 12$600 to $699
- 74$700 to $799
- 74$800 to $899
- 77$900 to $999
- 380$1,000 to $1,249
- 109$1,250 to $1,499
- 15$1,500 to $1,999

Median rent in 2022:
| Hanover Place: | $1,088 |
| Kansas City: | $959 |
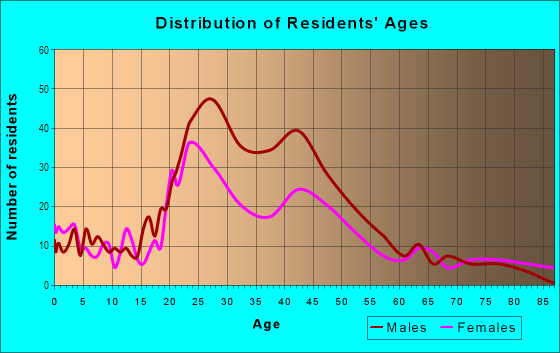
| Males: | 966 |
| Females: | 1,011 |
Males:
| This neighborhood: | 39.7 years |
| Whole city: | 35.3 years |
| This neighborhood: | 36.5 years |
| Whole city: | 36.6 years |
Average household size:
| Hanover Place: | 1.8 people |
| Kansas City: | 2.2 people |
Percentage of family households:
| Hanover Place: | 15.6% |
| Kansas City: | 37.9% |
| Here: | 15.0% |
| Kansas City: | 35.0% |
Percentage of married-couple families with children (among all households):
| Hanover Place: | 48.5% |
| Kansas City: | 26.7% |
Percentage of single-mother households (among all households):
| Hanover Place: | 5.7% |
| Kansas City: | 14.3% |
Percentage of never married males 15 years old and over:
Percentage of never married females 15 years old and over:
| Hanover Place: | 34.1% |
| Kansas City: | 20.0% |
Percentage of never married females 15 years old and over:
| Hanover Place: | 29.1% |
| city: | 20.0% |
Percentage of people that speak English not well or not at all:
| Hanover Place: | 1.1% |
| Kansas City: | 2.5% |
Percentage of people born in this state:
Percentage of people born in another U.S. state:
Percentage of native residents but born outside the U.S.:
Percentage of foreign born residents:
| Here: | 44.1% |
| Kansas City: | 53.2% |
Percentage of people born in another U.S. state:
| Hanover Place: | 49.1% |
| Kansas City: | 38.2% |
Percentage of native residents but born outside the U.S.:
| Here: | 0.0% |
| city: | 1.0% |
Percentage of foreign born residents:
| Here: | 6.8% |
| Kansas City: | 7.6% |
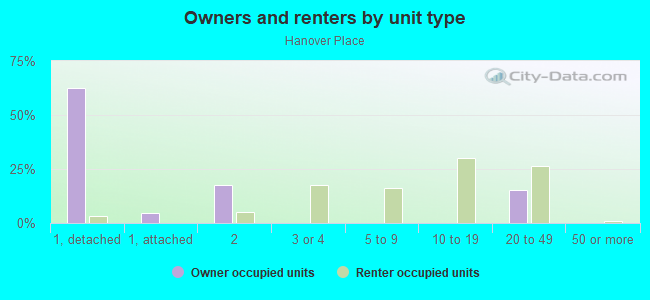
Owner-occupied
Renter-occupied

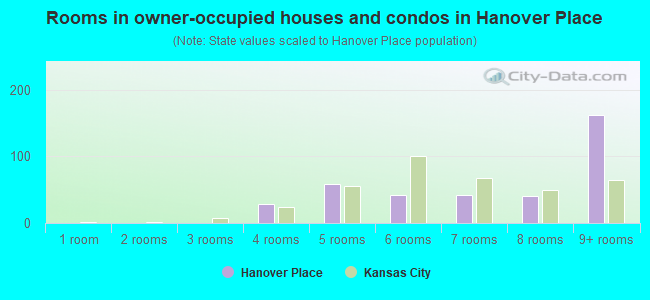
- Rooms in owner-occupied houses and condos in Hanover Place
- 01 room
- 02 rooms
- 03 rooms
- 284 rooms
- 585 rooms
- 426 rooms
- 427 rooms
- 408 rooms
- 1629+ rooms
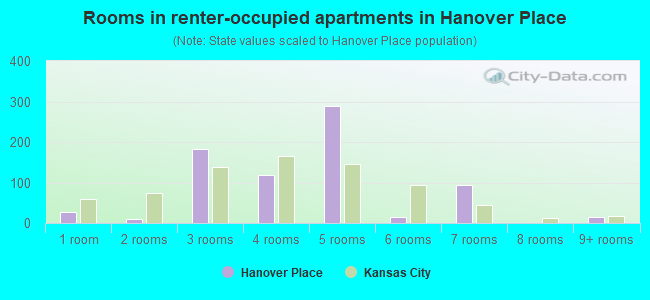
- Rooms in renter-occupied apartments in Hanover Place
- 281 room
- 102 rooms
- 1833 rooms
- 1194 rooms
- 2905 rooms
- 146 rooms
- 957 rooms
- 08 rooms
- 159+ rooms
Owner-occupied
Renter-occupied
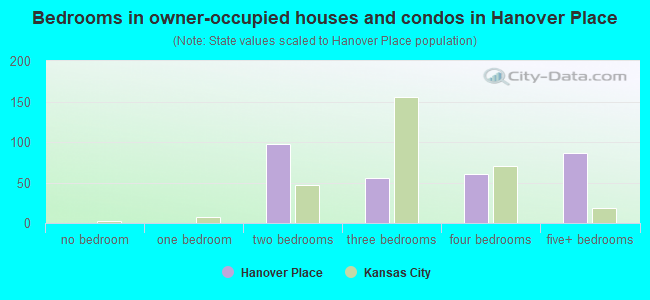
- Bedrooms in owner-occupied houses and condos in Hanover Place
- 0no bedroom
- 01 bedroom
- 972 bedrooms
- 553 bedrooms
- 614 bedrooms
- 865+ bedrooms
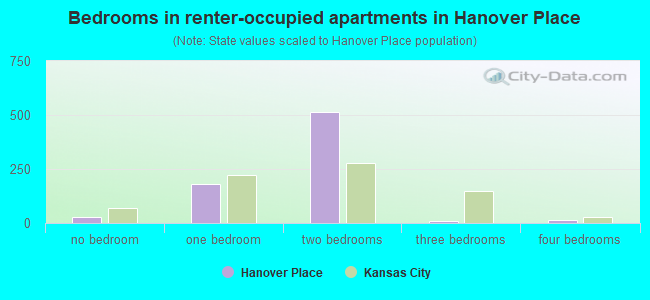
- Bedrooms in renter-occupied apartments in Hanover Place
- 28no bedroom
- 1801 bedroom
- 5122 bedrooms
- 93 bedrooms
- 154 bedrooms
- 05+ bedrooms
Average number of cars or other vehicles available in houses/condos:
Average number of cars or other vehicles available in apartments:
| This neighborhood: | 1.7 |
| Kansas City: | 1.9 |
Average number of cars or other vehicles available in apartments:
| Here: | 1.3 |
| city: | 1.2 |
Percentage of units with a mortgage:
| Hanover Place: | 76.9% |
| Kansas City: | 62.2% |
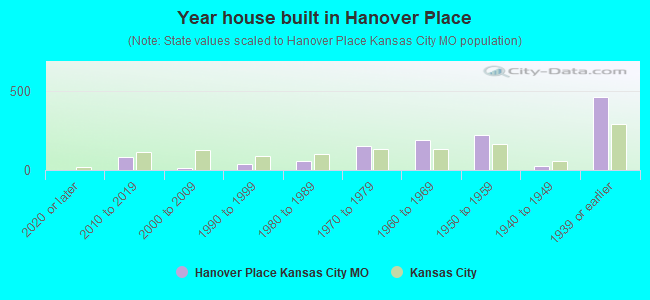
- Year house built in Hanover Place
- 02020 or later
- 802010 to 2019
- 132000 to 2009
- 371990 to 1999
- 581980 to 1989
- 1491970 to 1979
- 1901960 to 1969
- 2191950 to 1959
- 251940 to 1949
- 4581939 or earlier
City-data.com crime index for city in 2020 (higher means more crime):
| City: | 671.9 |
| U.S. average: | 219.5 |
Travel time to work (commute)
![Travel time to work (commute)]()
- 6Less than 5 minutes
- 1755 to 9 minutes
- 19010 to 14 minutes
- 17415 to 19 minutes
- 8720 to 24 minutes
- 8525 to 29 minutes
- 10830 to 34 minutes
- 1635 to 39 minutes
- 1345 to 59 minutes
- 690 or more minutes

Means of transportation to work
![Means of transportation to work]()
- 67.4%932Drove a car alone
- 5.7%79Carpooled
- 6.9%95Bus
- 2.2%30Bicycle
- 0.2%3Walked
- 20.8%287Worked at home

Time leaving home to go to work
![Time leaving home to go to work]()
- 55:30 a.m. to 5:59 a.m.
- 116:00 a.m. to 6:29 a.m.
- 886:30 a.m. to 6:59 a.m.
- 1127:00 a.m. to 7:29 a.m.
- 2667:30 a.m. to 7:59 a.m.
- 1098:00 a.m. to 8:29 a.m.
- 438:30 a.m. to 8:59 a.m.
- 769:00 a.m. to 9:59 a.m.
- 5310:00 a.m. to 10:59 a.m.
- 2111:00 a.m. to 11:59 a.m.
- 5012:00 p.m. to 3:59 p.m.
- 234:00 p.m. to 11:59 p.m.

Occupations of males:
- Percentage of males in management occupations (except farmers):
Here: 19.1% city: 11.5%
- Percentage of males in business and financial operations occupations:
Here: 17.2% city: 5.6%
- Percentage of males in computer and mathematical occupations:
Here: 12.8% city: 6.1%
- Percentage of males in legal occupations:
Here: 2.4% city: 1.3%
- Percentage of males in education, training, and library occupations:
Here: 5.2% city: 2.6%
- Percentage of males in arts, design, entertainment, sports, and media occupations:
Here: 2.7% city: 2.4%
- Percentage of males in healthcare practitioners and technical occupations:
Here: 1.9% city: 3.4%
- Percentage of males in service occupations:
Here: 8.8% city: 13.8%
- Percentage of males in sales and office occupations:
Here: 13.2% city: 16.1%
- Percentage of males in construction, extraction, and maintenance occupations:
Here: 2.7% city: 7.3%
- Percentage of males in production occupations:
Here: 6.4% city: 6.9%
- Percentage of males in material moving occupations:
Here: 2.9% city: 6.3%
Occupations of females:
- Percentage of females in management occupations (except farmers):
Here: 10.7% city: 9.9%
- Percentage of females in business and financial operations occupations:
Here: 16.8% city: 7.2%
- Percentage of females in life, physical, and social science occupations:
Here: 1.8% city: 1.1%
- Percentage of females in community and social services occupations:
Here: 5.0% city: 2.9%
- Percentage of females in legal occupations:
Here: 1.4% city: 1.6%
- Percentage of females in education, training, and library occupations:
Here: 11.6% city: 8.0%
- Percentage of females in arts, design, entertainment, sports, and media occupations:
Here: 3.6% city: 2.7%
- Percentage of females in healthcare practitioners and technical occupations:
Here: 8.4% city: 10.3%
- Percentage of females in service occupations:
Here: 11.1% city: 18.7%
- Percentage of females in sales and office occupations:
Here: 24.1% city: 26.2%
- Percentage of females in production occupations:
Here: 2.5% city: 3.3%
- Percentage of females in material moving occupations:
Here: 2.6% city: 3.0%
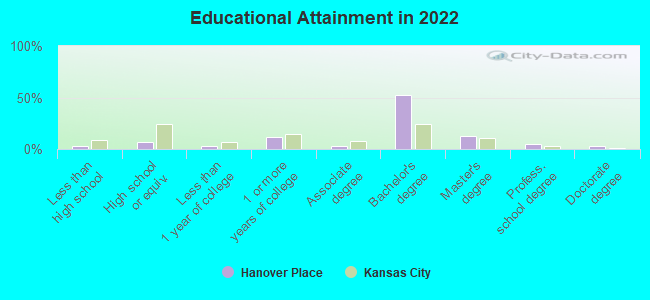
Education in this neighborhood (subdivision or community):
- Percentage of people 3 years and older in K-12 schools:
Hanover Place: 7.0% Kansas City: 15.8%
- Percentage of people 3 years and older in undergraduate colleges:
Hanover Place: 10.1% Kansas City: 5.0%
- Percentage of people 3 years and older in grad. or professional schools:
Hanover Place: 6.7% Kansas City: 1.7%
- Percentage of students K-12 enrolled in private schools:
Hanover Place: 65.2% Kansas City: 14.7%
Percentage of population below poverty level:
| Hanover Place: | 7.0% |
| Kansas City: | 14.6% |
Median year owner moved in (as recorded in 2022):
Median year renter moved in (as recorded in 2022):
| Hanover Place: | 2013 |
| Kansas City: | 2012 |
Median year renter moved in (as recorded in 2022):
| Hanover Place: | 2017 |
| Kansas City: | 2020 |
Percentage of married-couple families with both working:
| Hanover Place: | 92.0% |
| Kansas City: | 76.6% |
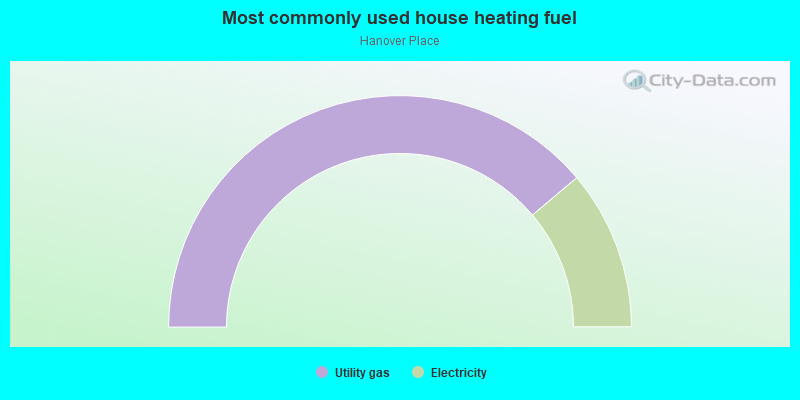
- 77.7%Utility gas
- 22.3%Electricity
Roads and streets:
Gillham Rd
Length: 0.53 miles
Directions: N-S, SE-NW, SW-NE
Address range: 3500 to 3855
Directions: N-S, SE-NW, SW-NE
Address range: 3500 to 3855
Oak St
Length: 0.39 miles
Direction: N-S
Address range: 3535 to 3899
Direction: N-S
Address range: 3535 to 3899
Warwick Blvd
Length: 0.35 miles
Direction: N-S
Address range: 3550 to 3799
Direction: N-S
Address range: 3550 to 3799
Broadway St
Length: 0.33 miles
Direction: N-S
Address range: 3537 to 3815
Direction: N-S
Address range: 3537 to 3815
W 36th St (W 36 St)
Length: 0.32 miles
Direction: E-W
Address range: 1 to 399
Direction: E-W
Address range: 1 to 399
W 37th St (W 37 St)
Length: 0.32 miles
Direction: E-W
Address range: 1 to 399
Direction: E-W
Address range: 1 to 399
W 38th St (W 38 St)
Length: 0.32 miles
Direction: E-W
Address range: 1 to 399
Direction: E-W
Address range: 1 to 399
E 36th St (E 36 St)
Length: 0.32 miles
Direction: E-W
Address range: 1 to 399
Direction: E-W
Address range: 1 to 399
E 38th St (E 38 St)
Length: 0.32 miles
Direction: E-W
Address range: 1 to 399
Direction: E-W
Address range: 1 to 399
Walnut St
Length: 0.25 miles
Direction: N-S
Address range: 3600 to 3799
Direction: N-S
Address range: 3600 to 3799
Main St
Length: 0.25 miles
Direction: N-S
Address range: 3600 to 3799
Direction: N-S
Address range: 3600 to 3799
Central St
Length: 0.25 miles
Direction: N-S
Address range: 3600 to 3799
Direction: N-S
Address range: 3600 to 3799
Wyandotte St
Length: 0.25 miles
Direction: N-S
Address range: 3600 to 3799
Direction: N-S
Address range: 3600 to 3799
Baltimore Ave
Length: 0.25 miles
Direction: N-S
Address range: 3600 to 3799
Direction: N-S
Address range: 3600 to 3799
E 37th St (E 37 St)
Length: 0.24 miles
Direction: E-W
Address range: 1 to 299
Direction: E-W
Address range: 1 to 299
Mc Gee St
Length: 0.16 miles
Direction: N-S
Address range: 3500 to 3599
Direction: N-S
Address range: 3500 to 3599
E Armour Blvd
Length: 0.08 miles
Direction: E-W
Address range: 300 to 399
Direction: E-W
Address range: 300 to 399
Warwick Ct
Length: 0.05 miles
Direction: N-S
Address range: 3500 to 3599
Direction: N-S
Address range: 3500 to 3599