H Street Corridor District neighborhood in Chula Vista, California (CA), 91910 detailed profile
Settings
X


Business Search - 14 Million verified businesses
Area: 0.372 square miles
Population: 2,988
Population density:
| H Street Corridor District: | 8,028 people per square mile |
| Chula Vista: | 5,711 people per square mile |

- 2,38678.9%Hispanic or Latino
- 2749.1%White
- 1384.6%Black
- 1093.6%Asian
- 491.6%Two or more races
- 331.1%American Indian
- 341.1%Native Hawaiian and Other
Pacific Islander

Median household income in 2022:
| H Street Corridor District: | $61,938 |
| Chula Vista: | $101,190 |
Distribution of median household income
![Distribution of median household income]()
- 42Less than $10,000
- 166$10,000 to $19,999
- 113$20,000 to $29,999
- 83$30,000 to $39,999
- 91$40,000 to $49,999
- 70$50,000 to $59,999
- 162$60,000 to $74,999
- 155$75,000 to $99,999
- 105$100,000 to $124,999
- 52$125,000 to $149,999
- 56$150,000 to $199,999
- 25$200,000 or more

Distribution of owner-occupied house/condo value
![Distribution of owner-occupied house/condo value]()
- 64Less than $50,000
- 21$50,000 to $99,999
- 31$150,000 to $199,999
- 32$300,000 to $399,999
- 36$400,000 to $499,999
- 145$500,000 to $749,999
- 47$750,000 to $999,999
- 9$1,000,000 or more

Distribution of rent paid by renters
![Distribution of rent paid by renters]()
- 40$200 to $299
- 105$300 to $399
- 2$500 to $599
- 14$800 to $899
- 60$900 to $999
- 114$1,000 to $1,249
- 227$1,250 to $1,499
- 301$1,500 to $1,999
- 164$2,000 or more

Median rent in 2022:
| H Street Corridor District: | $1,499 |
| Chula Vista: | $1,879 |
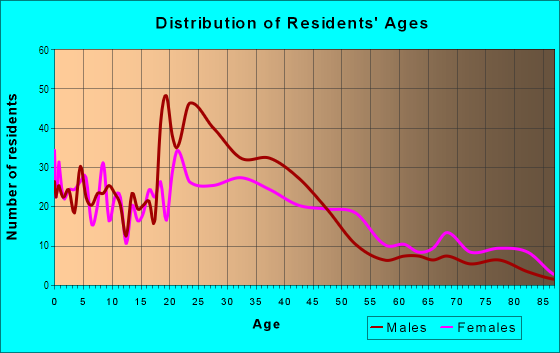
| Males: | 1,329 |
| Females: | 1,659 |
Males:
| This neighborhood: | 38.4 years |
| Whole city: | 34.8 years |
| This neighborhood: | 43.7 years |
| Whole city: | 37.4 years |
Average household size:
| H Street Corridor District: | 2.6 people |
| Chula Vista: | 3.2 people |
Percentage of family households:
| H Street Corridor District: | 46.8% |
| Chula Vista: | 57.2% |
| Here: | 40.8% |
| Chula Vista: | 54.5% |
Percentage of married-couple families with children (among all households):
| H Street Corridor District: | 23.9% |
| Chula Vista: | 22.9% |
Percentage of single-mother households (among all households):
| H Street Corridor District: | 10.6% |
| Chula Vista: | 5.5% |
Percentage of never married males 15 years old and over:
Percentage of never married females 15 years old and over:
| H Street Corridor District: | 16.4% |
| Chula Vista: | 19.8% |
Percentage of never married females 15 years old and over:
| H Street Corridor District: | 19.7% |
| city: | 16.5% |
Percentage of people that speak English not well or not at all:
| H Street Corridor District: | 14.8% |
| Chula Vista: | 8.7% |
Percentage of people born in this state:
Percentage of people born in another U.S. state:
Percentage of native residents but born outside the U.S.:
Percentage of foreign born residents:
| Here: | 53.7% |
| Chula Vista: | 56.5% |
Percentage of people born in another U.S. state:
| H Street Corridor District: | 12.6% |
| Chula Vista: | 13.1% |
Percentage of native residents but born outside the U.S.:
| Here: | 1.7% |
| city: | 2.8% |
Percentage of foreign born residents:
| Here: | 32.0% |
| Chula Vista: | 27.6% |

Owner-occupied
Renter-occupied


- Rooms in owner-occupied houses and condos in H Street Corridor District
- 41 room
- 02 rooms
- 663 rooms
- 654 rooms
- 525 rooms
- 326 rooms
- 837 rooms
- 438 rooms
- 339+ rooms

- Rooms in renter-occupied apartments in H Street Corridor District
- 271 room
- 1262 rooms
- 2473 rooms
- 3284 rooms
- 565 rooms
- 466 rooms
- 87 rooms
- 368 rooms
- 119+ rooms
Owner-occupied
Renter-occupied

- Bedrooms in owner-occupied houses and condos in H Street Corridor District
- 4no bedroom
- 61 bedroom
- 1372 bedrooms
- 723 bedrooms
- 314 bedrooms
- 335+ bedrooms

- Bedrooms in renter-occupied apartments in H Street Corridor District
- 27no bedroom
- 2651 bedroom
- 4392 bedrooms
- 1043 bedrooms
- 404 bedrooms
- 115+ bedrooms
Average number of cars or other vehicles available in houses/condos:
Average number of cars or other vehicles available in apartments:
| This neighborhood: | 1.9 |
| Chula Vista: | 2.4 |
Average number of cars or other vehicles available in apartments:
| Here: | 1.6 |
| city: | 1.7 |
Percentage of units with a mortgage:
| H Street Corridor District: | 55.7% |
| Chula Vista: | 76.0% |

- Year house built in H Street Corridor District
- 02020 or later
- 492010 to 2019
- 212000 to 2009
- 201990 to 1999
- 871980 to 1989
- 3291970 to 1979
- 2741960 to 1969
- 3381950 to 1959
- 831940 to 1949
- 981939 or earlier

City-data.com crime index for city in 2020 (higher means more crime):
| City: | 159.8 |
| U.S. average: | 219.5 |
Travel time to work (commute)
![Travel time to work (commute)]()
- 28Less than 5 minutes
- 585 to 9 minutes
- 22110 to 14 minutes
- 31815 to 19 minutes
- 16020 to 24 minutes
- 19925 to 29 minutes
- 19230 to 34 minutes
- 8035 to 39 minutes
- 1740 to 44 minutes
- 6245 to 59 minutes
- 5860 to 89 minutes
- 2090 or more minutes

Means of transportation to work
![Means of transportation to work]()
- 78.0%1,087Drove a car alone
- 13.5%188Carpooled
- 1.7%24Bus
- 6.1%85Subway or elevated rail
- 1.9%26Light rail, streetcar or trolley
- 0.9%13Motorcycle
- 0.7%10Bicycle
- 1.9%26Walked
- 0.4%5Other means
- 3.6%50Worked at home

Time leaving home to go to work
![Time leaving home to go to work]()
- 9112:00 a.m. to 4:59 a.m.
- 805:00 a.m. to 5:29 a.m.
- 775:30 a.m. to 5:59 a.m.
- 486:00 a.m. to 6:29 a.m.
- 1276:30 a.m. to 6:59 a.m.
- 1417:00 a.m. to 7:29 a.m.
- 2447:30 a.m. to 7:59 a.m.
- 1218:00 a.m. to 8:29 a.m.
- 798:30 a.m. to 8:59 a.m.
- 959:00 a.m. to 9:59 a.m.
- 3710:00 a.m. to 10:59 a.m.
- 2311:00 a.m. to 11:59 a.m.
- 14712:00 p.m. to 3:59 p.m.
- 1064:00 p.m. to 11:59 p.m.

Occupations of males:
- Percentage of males in management occupations (except farmers):
Here: 4.3% city: 9.9%
- Percentage of males in business and financial operations occupations:
Here: 2.5% city: 6.5%
- Percentage of males in architecture and engineering occupations:
Here: 4.3% city: 4.8%
- Percentage of males in education, training, and library occupations:
Here: 1.5% city: 2.3%
- Percentage of males in healthcare practitioners and technical occupations:
Here: 1.0% city: 3.0%
- Percentage of males in service occupations:
Here: 25.2% city: 18.4%
- Percentage of males in sales and office occupations:
Here: 9.8% city: 16.0%
- Percentage of males in construction, extraction, and maintenance occupations:
Here: 16.4% city: 9.2%
- Percentage of males in production occupations:
Here: 14.2% city: 5.7%
- Percentage of males in transportation occupations:
Here: 4.2% city: 5.1%
- Percentage of males in material moving occupations:
Here: 7.0% city: 3.7%
Occupations of females:
- Percentage of females in management occupations (except farmers):
Here: 3.1% city: 8.6%
- Percentage of females in business and financial operations occupations:
Here: 2.1% city: 5.6%
- Percentage of females in computer and mathematical occupations:
Here: 1.3% city: 1.2%
- Percentage of females in architecture and engineering occupations:
Here: 1.3% city: 1.0%
- Percentage of females in education, training, and library occupations:
Here: 8.3% city: 7.6%
- Percentage of females in healthcare practitioners and technical occupations:
Here: 1.5% city: 10.6%
- Percentage of females in service occupations:
Here: 37.9% city: 22.6%
- Percentage of females in sales and office occupations:
Here: 35.3% city: 29.5%
- Percentage of females in construction, extraction, and maintenance occupations:
Here: 1.5% city: 0.2%
- Percentage of females in production occupations:
Here: 7.3% city: 3.0%
Percentage of people 16-64 in Armed Forces:
| H Street Corridor District: | 1.1% |
| Chula Vista: | 4.1% |
Education in this neighborhood (subdivision or community):
- Percentage of people 3 years and older in K-12 schools:
H Street Corridor District: 14.3% Chula Vista: 22.0%
- Percentage of people 3 years and older in undergraduate colleges:
H Street Corridor District: 7.3% Chula Vista: 7.6%
- Percentage of people 3 years and older in grad. or professional schools:
H Street Corridor District: 1.0% Chula Vista: 1.2%
- Percentage of students K-12 enrolled in private schools:
H Street Corridor District: 28.1% Chula Vista: 7.0%
Percentage of population below poverty level:
| H Street Corridor District: | 10.7% |
| Chula Vista: | 10.1% |
Median year owner moved in (as recorded in 2022):
Median year renter moved in (as recorded in 2022):
| H Street Corridor District: | 2007 |
| Chula Vista: | 2011 |
Median year renter moved in (as recorded in 2022):
| H Street Corridor District: | 2015 |
| Chula Vista: | 2018 |
Percentage of married-couple families with both working:
| H Street Corridor District: | 56.4% |
| Chula Vista: | 69.2% |

- 61.3%Utility gas
- 26.0%Electricity
- 4.9%No fuel used
- 3.4%Other fuel
- 2.8%Solar energy
- 0.9%Bottled, tank, or LP gas
- 0.7%Wood
Roads and streets:
H St
Length: 0.73 miles
Direction: E-W
Address range: 300 to 549
Direction: E-W
Address range: 300 to 549
I St
Length: 0.70 miles
Direction: E-W
Address range: 300 to 539
Direction: E-W
Address range: 300 to 539
4th Ave
Length: 0.45 miles
Direction: N-S
Address range: 429 to 599
Direction: N-S
Address range: 429 to 599
3rd Ave
Length: 0.38 miles
Direction: N-S
Address range: 446 to 599
Direction: N-S
Address range: 446 to 599
Mankato St
Length: 0.29 miles
Direction: E-W
Address range: 300 to 399
Direction: E-W
Address range: 300 to 399
Roosevelt St
Length: 0.29 miles
Direction: E-W
Address range: 300 to 399
Direction: E-W
Address range: 300 to 399
Fig Ave
Length: 0.25 miles
Direction: N-S
Address range: 500 to 599
Direction: N-S
Address range: 500 to 599
Smith Ave
Length: 0.22 miles
Directions: N-S, SE-NW
Address range: 408 to 499
Directions: N-S, SE-NW
Address range: 408 to 499
Glover Ave
Length: 0.22 miles
Direction: N-S
Address range: 500 to 599
Direction: N-S
Address range: 500 to 599
Guava Ave
Length: 0.19 miles
Direction: N-S
Address range: 520 to 599
Direction: N-S
Address range: 520 to 599
Garrett Ave
Length: 0.19 miles
Direction: N-S
Address range: 500 to 582
Direction: N-S
Address range: 500 to 582
Otis St
Length: 0.15 miles
Direction: E-W
Address range: 500 to 549
Direction: E-W
Address range: 500 to 549
Shasta Dr
Length: 0.14 miles
Direction: E-W
Address range: 410 to 450
Direction: E-W
Address range: 410 to 450
Vance St
Length: 0.12 miles
Direction: E-W
Address range: 300 to 499
Direction: E-W
Address range: 300 to 499
5th Ave
Length: 0.10 miles
Direction: N-S
Address range: 452 to 499
Direction: N-S
Address range: 452 to 499