Greenville neighborhood in Charlotte, North Carolina (NC), 28206 detailed profile
Settings
X


Business Search - 14 Million verified businesses
Area: 0.347 square miles
Population: 796
Population density:
| Greenville: | 2,292 people per square mile |
| Charlotte: | 3,705 people per square mile |

- 77888.1%Black
- 414.6%Hispanic or Latino
- 323.6%Asian
- 182.0%White
- 131.5%Two or more races
- 10.1%Some other race

Median household income in 2022:
| Greenville: | $38,405 |
| Charlotte: | $74,401 |
Distribution of median household income
![Distribution of median household income]()
- 8Less than $10,000
- 49$10,000 to $19,999
- 28$20,000 to $29,999
- 31$30,000 to $39,999
- 91$40,000 to $49,999
- 30$50,000 to $59,999
- 44$60,000 to $74,999
- 29$75,000 to $99,999
- 34$100,000 to $124,999
- 5$125,000 to $149,999
- 5$150,000 to $199,999
- 15$200,000 or more

Distribution of owner-occupied house/condo value
![Distribution of owner-occupied house/condo value]()
- 19Less than $50,000
- 71$50,000 to $99,999
- 78$100,000 to $149,999
- 67$150,000 to $199,999
- 8$200,000 to $249,999
- 21$250,000 to $299,999
- 8$300,000 to $399,999
- 15$400,000 to $499,999
- 3$500,000 to $749,999
- 1$750,000 to $999,999

Distribution of rent paid by renters
![Distribution of rent paid by renters]()
- 9Less than $100
- 58$200 to $299
- 17$300 to $399
- 12$400 to $499
- 51$500 to $599
- 52$600 to $699
- 34$700 to $799
- 6$800 to $899
- 49$900 to $999
- 27$1,000 to $1,249
- 22$1,250 to $1,499
- 20$1,500 to $1,999
- 4$2,000 or more

Median rent in 2022:
| Greenville: | $1,151 |
| Charlotte: | $1,334 |
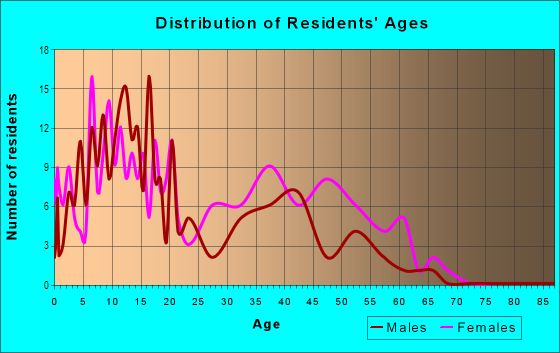
| Males: | 357 |
| Females: | 439 |
Males:
| This neighborhood: | 39.4 years |
| Whole city: | 33.8 years |
| This neighborhood: | 51.6 years |
| Whole city: | 35.3 years |
Average household size:
| Greenville: | 7.9 people |
| Charlotte: | 2.3 people |
Percentage of family households:
| Greenville: | 19.6% |
| Charlotte: | 42.8% |
| Here: | 26.6% |
| Charlotte: | 36.9% |
Percentage of married-couple families with children (among all households):
| Greenville: | 7.0% |
| Charlotte: | 27.1% |
Percentage of single-mother households (among all households):
| Greenville: | 25.9% |
| Charlotte: | 11.0% |
Percentage of never married males 15 years old and over:
Percentage of never married females 15 years old and over:
| Greenville: | 30.8% |
| Charlotte: | 21.6% |
Percentage of never married females 15 years old and over:
| Greenville: | 10.8% |
| city: | 22.1% |
Percentage of people that speak English not well or not at all:
| Greenville: | 0.0% |
| Charlotte: | 5.7% |
Percentage of people born in this state:
Percentage of people born in another U.S. state:
Percentage of native residents but born outside the U.S.:
Percentage of foreign born residents:
| Here: | 67.8% |
| Charlotte: | 40.1% |
Percentage of people born in another U.S. state:
| Greenville: | 32.1% |
| Charlotte: | 41.5% |
Percentage of native residents but born outside the U.S.:
| Here: | 1.0% |
| city: | 1.5% |
Percentage of foreign born residents:
| Here: | 3.9% |
| Charlotte: | 16.8% |

Owner-occupied
Renter-occupied


- Rooms in owner-occupied houses and condos in Greenville
- 01 room
- 02 rooms
- 63 rooms
- 44 rooms
- 1125 rooms
- 586 rooms
- 137 rooms
- 118 rooms
- 49+ rooms

- Rooms in renter-occupied apartments in Greenville
- 681 room
- 132 rooms
- 713 rooms
- 1464 rooms
- 425 rooms
- 166 rooms
- 237 rooms
- 08 rooms
- 09+ rooms
Owner-occupied
Renter-occupied

- Bedrooms in owner-occupied houses and condos in Greenville
- 0no bedroom
- 01 bedroom
- 142 bedrooms
- 1363 bedrooms
- 494 bedrooms
- 395+ bedrooms

- Bedrooms in renter-occupied apartments in Greenville
- 68no bedroom
- 1601 bedroom
- 62 bedrooms
- 543 bedrooms
- 164 bedrooms
- 05+ bedrooms
Average number of cars or other vehicles available in houses/condos:
Average number of cars or other vehicles available in apartments:
| This neighborhood: | 1.7 |
| Charlotte: | 2.0 |
Average number of cars or other vehicles available in apartments:
| Here: | 1.3 |
| city: | 1.4 |
Percentage of units with a mortgage:
| Greenville: | 70.9% |
| Charlotte: | 74.9% |
Average estimated value of detached houses in 2022 (99.3% of all units):
| Greenville: | $176,008 |
| Charlotte: | $527,854 |

- Year house built in Greenville
- 42020 or later
- 1222010 to 2019
- 132000 to 2009
- 511990 to 1999
- 1231980 to 1989
- 551970 to 1979
- 1091960 to 1969
- 281950 to 1959
- 351940 to 1949
- 301939 or earlier

Travel time to work (commute)
![Travel time to work (commute)]()
- 4Less than 5 minutes
- 105 to 9 minutes
- 1810 to 14 minutes
- 8615 to 19 minutes
- 2020 to 24 minutes
- 5525 to 29 minutes
- 330 to 34 minutes
- 935 to 39 minutes
- 440 to 44 minutes
- 545 to 59 minutes
- 1960 to 89 minutes
- 1990 or more minutes

Means of transportation to work
![Means of transportation to work]()
- 34.5%102Drove a car alone
- 34.5%102Carpooled
- 6.8%20Bus
- 5.4%16Subway or elevated rail
- 0.3%1Walked
- 2.7%8Other means
- 23.4%69Worked at home

Time leaving home to go to work
![Time leaving home to go to work]()
- 312:00 a.m. to 4:59 a.m.
- 45:00 a.m. to 5:29 a.m.
- 145:30 a.m. to 5:59 a.m.
- 606:00 a.m. to 6:29 a.m.
- 256:30 a.m. to 6:59 a.m.
- 127:00 a.m. to 7:29 a.m.
- 207:30 a.m. to 7:59 a.m.
- 558:00 a.m. to 8:29 a.m.
- 168:30 a.m. to 8:59 a.m.
- 129:00 a.m. to 9:59 a.m.
- 310:00 a.m. to 10:59 a.m.
- 711:00 a.m. to 11:59 a.m.
- 1112:00 p.m. to 3:59 p.m.
- 284:00 p.m. to 11:59 p.m.

Occupations of males:
- Percentage of males in management occupations (except farmers):
Here: 9.9% city: 15.2%
- Percentage of males in education, training, and library occupations:
Here: 2.6% city: 2.5%
- Percentage of males in service occupations:
Here: 13.8% city: 11.0%
- Percentage of males in sales and office occupations:
Here: 42.7% city: 16.3%
- Percentage of males in production occupations:
Here: 13.2% city: 4.9%
- Percentage of males in transportation occupations:
Here: 17.5% city: 5.6%
Occupations of females:
- Percentage of females in management occupations (except farmers):
Here: 2.6% city: 11.3%
- Percentage of females in community and social services occupations:
Here: 2.7% city: 2.6%
- Percentage of females in education, training, and library occupations:
Here: 10.9% city: 7.4%
- Percentage of females in healthcare practitioners and technical occupations:
Here: 17.4% city: 7.2%
- Percentage of females in sales and office occupations:
Here: 56.9% city: 26.2%
- Percentage of females in production occupations:
Here: 6.5% city: 2.9%
- Percentage of females in transportation occupations:
Here: 2.6% city: 1.8%
Percentage of people 16-64 in Armed Forces:
| Greenville: | 0.0% |
| Charlotte: | 0.3% |
Education in this neighborhood (subdivision or community):
- Percentage of people 3 years and older in K-12 schools:
Greenville: 19.8% Charlotte: 16.6%
- Percentage of people 3 years and older in undergraduate colleges:
Greenville: 3.2% Charlotte: 5.0%
- Percentage of people 3 years and older in grad. or professional schools:
Greenville: 4.0% Charlotte: 1.5%
- Percentage of students K-12 enrolled in private schools:
Greenville: 3.5% Charlotte: 10.1%
Percentage of population below poverty level:
| Greenville: | 17.3% |
| Charlotte: | 11.8% |
Median year owner moved in (as recorded in 2022):
Median year renter moved in (as recorded in 2022):
| Greenville: | 1998 |
| Charlotte: | 2012 |
Median year renter moved in (as recorded in 2022):
| Greenville: | 2016 |
| Charlotte: | 2020 |
Percentage of married-couple families with both working:
| Greenville: | 130.2% |
| Charlotte: | 66.4% |

- 53.6%Electricity
- 41.0%Utility gas
- 2.1%No fuel used
- 1.6%Fuel oil, kerosene, etc.
- 1.1%Bottled, tank, or LP gas
- 0.6%Solar energy
Limited-access highways (interstate or state) in this neighborhood:
State Hwy 16 (Brookshire Fwy W, I- 277)
Length: 0.94 miles
Direction: SE-NW
Direction: SE-NW
US Hwy 21 (I- 77)
Length: 0.53 miles
Directions: N-S, SW-NE
Directions: N-S, SW-NE
Roads and streets:
Polk St
Length: 0.89 miles
Directions: E-W, N-S, SE-NW, SW-NE
Address range: 800 to 1599
Directions: E-W, N-S, SE-NW, SW-NE
Address range: 800 to 1599
Hamilton St
Length: 0.71 miles
Directions: E-W, SE-NW, SW-NE
Address range: 900 to 1699
Directions: E-W, SE-NW, SW-NE
Address range: 900 to 1699
Fontana Ave
Length: 0.41 miles
Directions: E-W, SE-NW
Address range: 1000 to 1499
Directions: E-W, SE-NW
Address range: 1000 to 1499
Spring St
Length: 0.40 miles
Directions: E-W, SE-NW
Address range: 1200 to 1599
Directions: E-W, SE-NW
Address range: 1200 to 1599
Burton St
Length: 0.25 miles
Directions: N-S, SE-NW, SW-NE
Address range: 1200 to 1599
Directions: N-S, SE-NW, SW-NE
Address range: 1200 to 1599
Whisnant St
Length: 0.24 miles
Directions: E-W, N-S, SE-NW, SW-NE
Address range: 1300 to 1699
Directions: E-W, N-S, SE-NW, SW-NE
Address range: 1300 to 1699
N Johnson St
Length: 0.20 miles
Direction: SW-NE
Address range: 832 to 999
Direction: SW-NE
Address range: 832 to 999
W 12th St
Length: 0.20 miles
Directions: E-W, SE-NW
Address range: 900 to 1099
Directions: E-W, SE-NW
Address range: 900 to 1099
Callahan St
Length: 0.20 miles
Directions: E-W, N-S, SE-NW
Address range: 700 to 1099
Directions: E-W, N-S, SE-NW
Address range: 700 to 1099
Spratt St
Length: 0.10 miles
Directions: E-W, SE-NW
Directions: E-W, SE-NW
Statesville Ave
Length: 0.09 miles
Direction: N-S
Address range: 1300 to 1499
Direction: N-S
Address range: 1300 to 1499
Seaboard St
Length: 0.08 miles
Direction: E-W
Address range: 672 to 799
Direction: E-W
Address range: 672 to 799
Johnson St
Length: 0.08 miles
Directions: N-S, SW-NE
Address range: 1000 to 1099
Directions: N-S, SW-NE
Address range: 1000 to 1099
Canton Pl
Length: 0.07 miles
Direction: SE-NW
Address range: 900 to 999
Direction: SE-NW
Address range: 900 to 999
Wearn Ct
Length: 0.06 miles
Directions: N-S, SW-NE
Address range: 500 to 599
Directions: N-S, SW-NE
Address range: 500 to 599
Vogel Ct
Length: 0.04 miles
Direction: SW-NE
Address range: 1600 to 1699
Direction: SW-NE
Address range: 1600 to 1699
Bluff Ct
Length: 0.04 miles
Direction: SW-NE
Address range: 1600 to 1699
Direction: SW-NE
Address range: 1600 to 1699
Rembert Ct
Length: 0.03 miles
Directions: N-S, SW-NE
Address range: 1600 to 1699
Directions: N-S, SW-NE
Address range: 1600 to 1699
Lyme Brook Ln
Length: 0.02 miles
Direction: SW-NE
Address range: 900 to 999
Direction: SW-NE
Address range: 900 to 999
Railroad features:
Southern Rlwy
Length: 0.46 miles
Direction: SW-NE
Direction: SW-NE