Gold Coast neighborhood in Berwyn, Illinois (IL), 60402 detailed profile
Settings
X


Business Search - 14 Million verified businesses
Area: 0.175 square miles
Population: 2,873
Population density:
| Gold Coast: | 16,410 people per square mile |
| Berwyn: | 14,529 people per square mile |

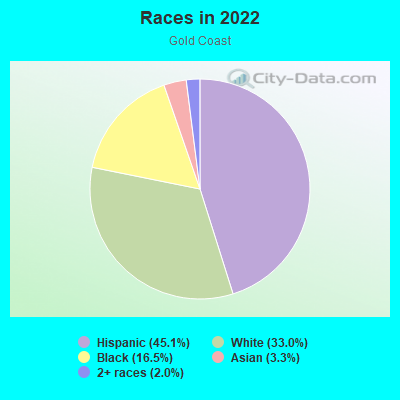
- 1,30945.1%Hispanic or Latino
- 95833.0%White
- 47816.5%Black
- 973.3%Asian
- 592.0%Two or more races
- 20.07%Some other race
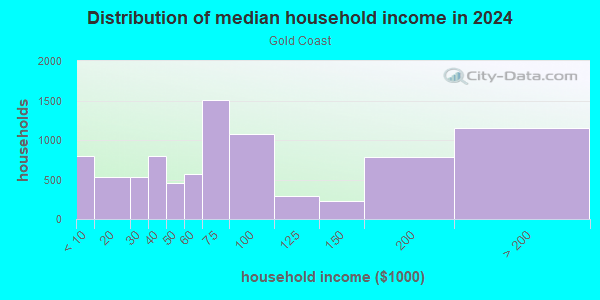
Median household income in 2022:
| Gold Coast: | $66,022 |
| Berwyn: | $71,300 |
Distribution of median household income
![Distribution of median household income]()
- 148Less than $10,000
- 131$10,000 to $19,999
- 480$20,000 to $29,999
- 124$30,000 to $39,999
- 52$40,000 to $49,999
- 125$50,000 to $59,999
- 142$60,000 to $74,999
- 120$75,000 to $99,999
- 65$100,000 to $124,999
- 14$125,000 to $149,999
- 127$150,000 to $199,999
- 25$200,000 or more
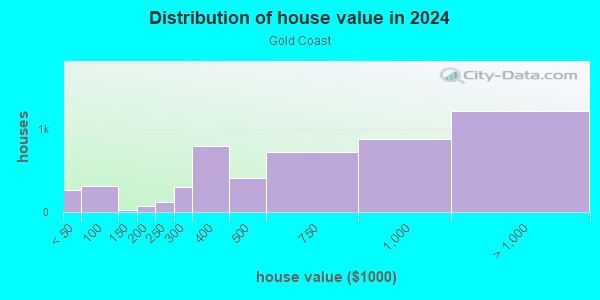
Distribution of owner-occupied house/condo value
![Distribution of owner-occupied house/condo value]()
- 41Less than $50,000
- 12$50,000 to $99,999
- 22$100,000 to $149,999
- 93$150,000 to $199,999
- 98$200,000 to $249,999
- 180$250,000 to $299,999
- 121$300,000 to $399,999
- 38$400,000 to $499,999
- 73$500,000 to $749,999
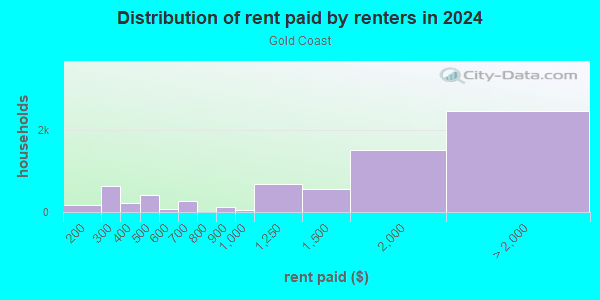
Distribution of rent paid by renters
![Distribution of rent paid by renters]()
- 3$100 to $199
- 44$200 to $299
- 2$400 to $499
- 1$500 to $599
- 2$600 to $699
- 136$700 to $799
- 176$800 to $899
- 230$900 to $999
- 125$1,000 to $1,249
- 187$1,250 to $1,499
- 25$1,500 to $1,999
- 50$2,000 or more
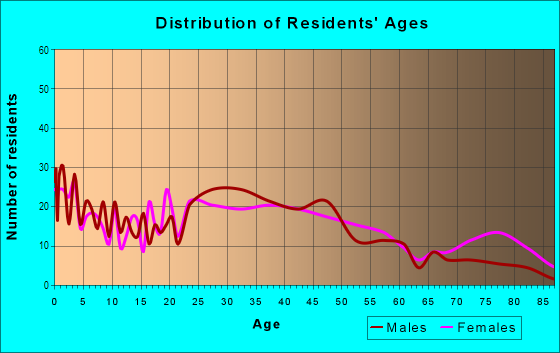
| Males: | 1,398 |
| Females: | 1,474 |
Males:
| This neighborhood: | 43.1 years |
| Whole city: | 35.6 years |
| This neighborhood: | 43.3 years |
| Whole city: | 37.2 years |
Average household size:
| Gold Coast: | 2.5 people |
| Berwyn: | 2.8 people |
Percentage of family households:
| Gold Coast: | 46.4% |
| Berwyn: | 51.5% |
| Here: | 54.0% |
| Berwyn: | 42.9% |
Percentage of married-couple families with children (among all households):
| Gold Coast: | 24.4% |
| Berwyn: | 21.2% |
Percentage of single-mother households (among all households):
| Gold Coast: | 18.5% |
| Berwyn: | 10.0% |
Percentage of never married males 15 years old and over:
Percentage of never married females 15 years old and over:
| Gold Coast: | 17.0% |
| Berwyn: | 24.4% |
Percentage of never married females 15 years old and over:
| Gold Coast: | 11.2% |
| city: | 18.7% |
Percentage of people that speak English not well or not at all:
| Gold Coast: | 2.3% |
| Berwyn: | 7.5% |
Percentage of people born in this state:
Percentage of people born in another U.S. state:
Percentage of native residents but born outside the U.S.:
Percentage of foreign born residents:
| Here: | 60.7% |
| Berwyn: | 63.7% |
Percentage of people born in another U.S. state:
| Gold Coast: | 11.7% |
| Berwyn: | 8.5% |
Percentage of native residents but born outside the U.S.:
| Here: | 4.4% |
| city: | 2.7% |
Percentage of foreign born residents:
| Here: | 23.2% |
| Berwyn: | 25.1% |
Owner-occupied
Renter-occupied

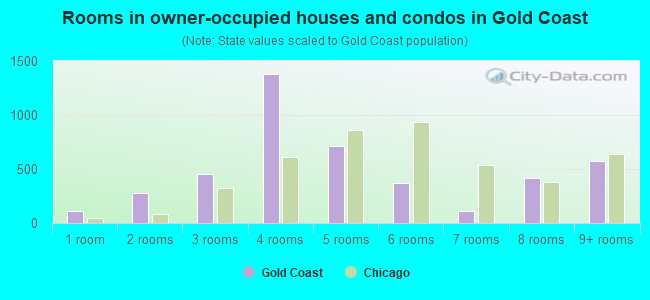
- Rooms in owner-occupied houses and condos in Gold Coast
- 61 room
- 42 rooms
- 143 rooms
- 394 rooms
- 1245 rooms
- 1896 rooms
- 1137 rooms
- 398 rooms
- 429+ rooms
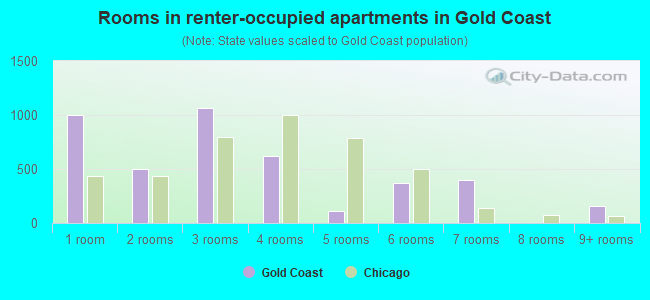
- Rooms in renter-occupied apartments in Gold Coast
- 661 room
- 352 rooms
- 1093 rooms
- 2894 rooms
- 775 rooms
- 736 rooms
- 1377 rooms
- 08 rooms
- 09+ rooms
Owner-occupied
Renter-occupied
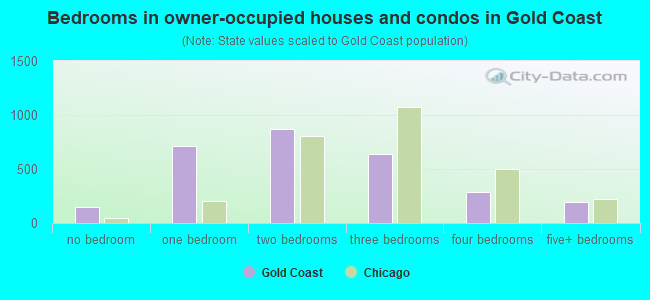
- Bedrooms in owner-occupied houses and condos in Gold Coast
- 6no bedroom
- 241 bedroom
- 2402 bedrooms
- 2423 bedrooms
- 474 bedrooms
- 315+ bedrooms
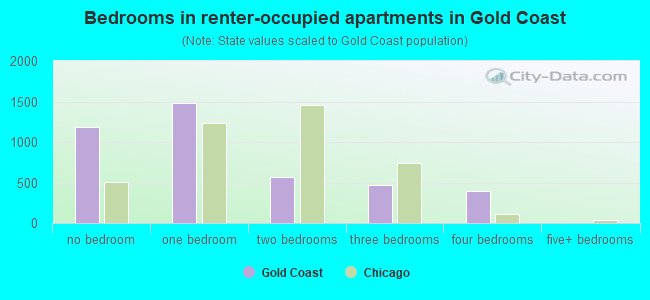
- Bedrooms in renter-occupied apartments in Gold Coast
- 66no bedroom
- 2201 bedroom
- 2992 bedrooms
- 933 bedrooms
- 454 bedrooms
- 05+ bedrooms
Average number of cars or other vehicles available in houses/condos:
Average number of cars or other vehicles available in apartments:
| This neighborhood: | 1.7 |
| Berwyn: | 2.0 |
Average number of cars or other vehicles available in apartments:
| Here: | 0.9 |
| city: | 1.2 |
Percentage of units with a mortgage:
| Gold Coast: | 57.0% |
| Berwyn: | 66.8% |
Housing prices:
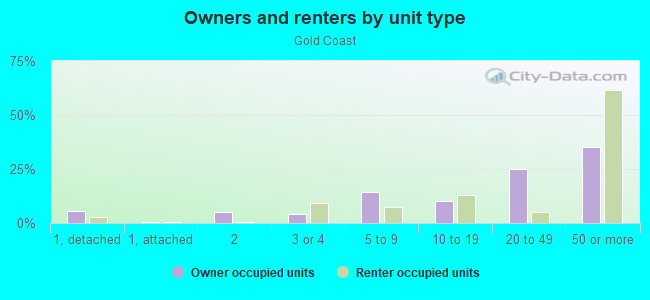
- Average estimated value of detached houses in 2022 (40.4% of all units):
Gold Coast: $293,408 Berwyn: $285,140
- Average estimated '22 value of housing units in 3-to-4-unit structures (13.8% of all units):
Gold Coast: $231,866 city: $329,802
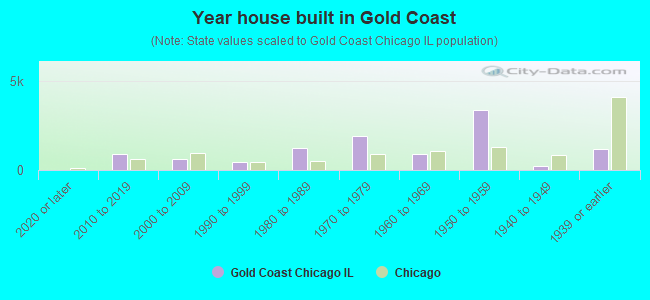
- Year house built in Gold Coast
- 02020 or later
- 02010 to 2019
- 32000 to 2009
- 241990 to 1999
- 581980 to 1989
- 501970 to 1979
- 1751960 to 1969
- 1761950 to 1959
- 1631940 to 1949
- 6961939 or earlier
City-data.com crime index for city in 2020 (higher means more crime):
| City: | 167.8 |
| U.S. average: | 219.5 |
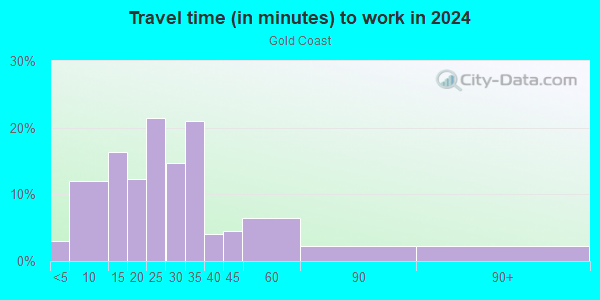
Travel time to work (commute)
![Travel time to work (commute)]()
- 4Less than 5 minutes
- 935 to 9 minutes
- 11610 to 14 minutes
- 15215 to 19 minutes
- 14420 to 24 minutes
- 3825 to 29 minutes
- 35630 to 34 minutes
- 4035 to 39 minutes
- 11640 to 44 minutes
- 10045 to 59 minutes
- 6860 to 89 minutes
- 690 or more minutes
Means of transportation to work
![Means of transportation to work]()
- 71.1%869Drove a car alone
- 10.5%129Carpooled
- 7.5%92Bus
- 9.7%119Subway or elevated rail
- 2.4%29Long-distance train or commuter rail
- 1.6%19Light rail, streetcar or trolley
- 0.1%1Taxi
- 0.1%1Bicycle
- 5.4%66Walked
- 2.6%32Other means
- 3.4%41Worked at home

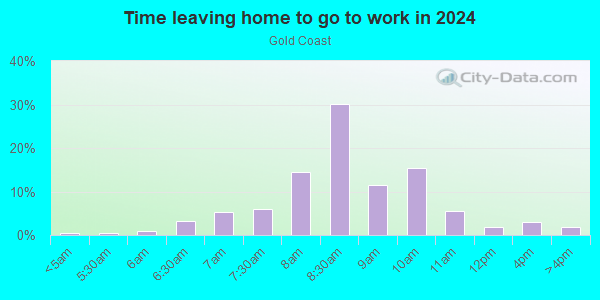
Time leaving home to go to work
![Time leaving home to go to work]()
- 9112:00 a.m. to 4:59 a.m.
- 715:00 a.m. to 5:29 a.m.
- 1235:30 a.m. to 5:59 a.m.
- 776:00 a.m. to 6:29 a.m.
- 1186:30 a.m. to 6:59 a.m.
- 1607:00 a.m. to 7:29 a.m.
- 2297:30 a.m. to 7:59 a.m.
- 968:00 a.m. to 8:29 a.m.
- 478:30 a.m. to 8:59 a.m.
- 1139:00 a.m. to 9:59 a.m.
- 510:00 a.m. to 10:59 a.m.
- 2011:00 a.m. to 11:59 a.m.
- 8312:00 p.m. to 3:59 p.m.
- 194:00 p.m. to 11:59 p.m.
Occupations of males:
- Percentage of males in management occupations (except farmers):
Here: 11.7% city: 9.2%
- Percentage of males in business and financial operations occupations:
Here: 1.3% city: 2.7%
- Percentage of males in computer and mathematical occupations:
Here: 2.8% city: 3.6%
- Percentage of males in community and social services occupations:
Here: 1.8% city: 0.3%
- Percentage of males in education, training, and library occupations:
Here: 6.4% city: 2.2%
- Percentage of males in arts, design, entertainment, sports, and media occupations:
Here: 2.3% city: 2.7%
- Percentage of males in service occupations:
Here: 6.9% city: 18.2%
- Percentage of males in sales and office occupations:
Here: 23.7% city: 16.5%
- Percentage of males in construction, extraction, and maintenance occupations:
Here: 8.9% city: 8.1%
- Percentage of males in production occupations:
Here: 2.3% city: 11.1%
- Percentage of males in transportation occupations:
Here: 5.2% city: 9.5%
- Percentage of males in material moving occupations:
Here: 14.6% city: 7.9%
Occupations of females:
- Percentage of females in management occupations (except farmers):
Here: 7.4% city: 7.9%
- Percentage of females in business and financial operations occupations:
Here: 14.3% city: 6.6%
- Percentage of females in computer and mathematical occupations:
Here: 1.5% city: 0.8%
- Percentage of females in life, physical, and social science occupations:
Here: 8.7% city: 0.8%
- Percentage of females in education, training, and library occupations:
Here: 6.1% city: 8.3%
- Percentage of females in arts, design, entertainment, sports, and media occupations:
Here: 3.1% city: 2.8%
- Percentage of females in healthcare practitioners and technical occupations:
Here: 10.1% city: 8.8%
- Percentage of females in service occupations:
Here: 26.8% city: 22.1%
- Percentage of females in sales and office occupations:
Here: 14.9% city: 28.7%
- Percentage of females in transportation occupations:
Here: 2.9% city: 1.6%
- Percentage of females in material moving occupations:
Here: 4.0% city: 2.1%
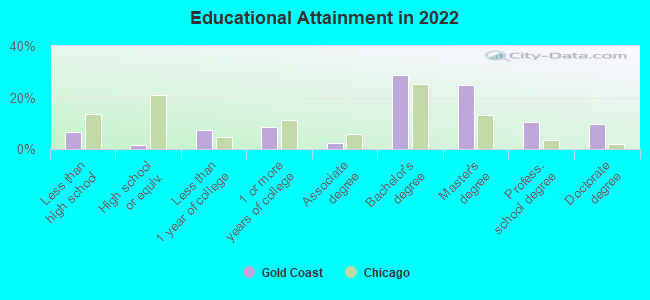
Education in this neighborhood (subdivision or community):
- Percentage of people 3 years and older in K-12 schools:
Gold Coast: 14.9% Berwyn: 19.3%
- Percentage of people 3 years and older in undergraduate colleges:
Gold Coast: 4.8% Berwyn: 5.1%
- Percentage of people 3 years and older in grad. or professional schools:
Gold Coast: 0.6% Berwyn: 1.0%
- Percentage of students K-12 enrolled in private schools:
Gold Coast: 41.3% Berwyn: 12.8%
Percentage of population below poverty level:
| Gold Coast: | 4.4% |
| Berwyn: | 11.0% |
Median year owner moved in (as recorded in 2022):
| Gold Coast: | 2005 |
| Berwyn: | 2007 |
Percentage of married-couple families with both working:
| Gold Coast: | 105.9% |
| Berwyn: | 65.6% |
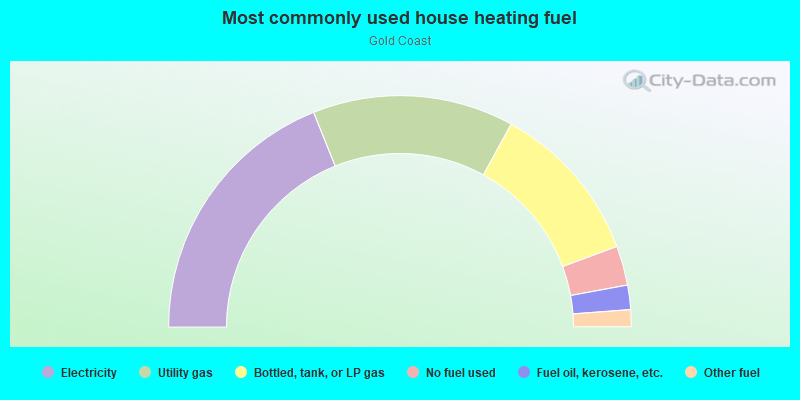
- 82.3%Utility gas
- 8.0%Electricity
- 6.1%No fuel used
- 3.6%Bottled, tank, or LP gas
Highways in this neighborhood:
State Rte 43 (Harlem Ave)
Length: 0.22 miles
Directions: N-S, SE-NW, SW-NE
Address range: 2100 to 2199
Directions: N-S, SE-NW, SW-NE
Address range: 2100 to 2199
Roads and streets:
Clinton Ave
Length: 0.47 miles
Direction: N-S
Address range: 1630 to 2199
Direction: N-S
Address range: 1630 to 2199
Home Ave
Length: 0.47 miles
Direction: N-S
Address range: 1630 to 2199
Direction: N-S
Address range: 1630 to 2199
Wisconsin Ave
Length: 0.47 miles
Direction: N-S
Address range: 1630 to 2199
Direction: N-S
Address range: 1630 to 2199
Wenonah Ave
Length: 0.47 miles
Direction: N-S
Address range: 1630 to 2199
Direction: N-S
Address range: 1630 to 2199
Maple Ave
Length: 0.47 miles
Direction: N-S
Address range: 1630 to 2199
Direction: N-S
Address range: 1630 to 2199
21st St
Length: 0.45 miles
Direction: E-W
Address range: 6928 to 7199
Direction: E-W
Address range: 6928 to 7199
W Cermak Rd (Cermak Rd)
Length: 0.45 miles
Directions: E-W, SW-NE
Address range: 6927 to 7189
Directions: E-W, SW-NE
Address range: 6927 to 7189
19th St
Length: 0.41 miles
Direction: E-W
Address range: 6925 to 7165
Direction: E-W
Address range: 6925 to 7165
18th St
Length: 0.40 miles
Direction: E-W
Address range: 6924 to 7165
Direction: E-W
Address range: 6924 to 7165