Gloucester Crossing neighborhood in Beverly, Massachusetts (MA), 01915 detailed profile
Settings
X


Business Search - 14 Million verified businesses
Area: 0.113 square miles
Population: 734
Population density:
| Gloucester Crossing: | 6,470 people per square mile |
| Beverly: | 2,555 people per square mile |

- 53670.3%White
- 14118.5%Hispanic or Latino
- 526.8%Asian
- 182.4%Two or more races
- 152.0%Black

Median household income in 2022:
| Gloucester Crossing: | $115,126 |
| Beverly: | $99,525 |
Distribution of median household income
![Distribution of median household income]()
- 13Less than $10,000
- 44$10,000 to $19,999
- 59$20,000 to $29,999
- 11$30,000 to $39,999
- 90$40,000 to $49,999
- 12$50,000 to $59,999
- 21$60,000 to $74,999
- 32$75,000 to $99,999
- 37$100,000 to $124,999
- 44$125,000 to $149,999
- 37$150,000 to $199,999
- 69$200,000 or more

Distribution of owner-occupied house/condo value
![Distribution of owner-occupied house/condo value]()
- 8Less than $50,000
- 3$50,000 to $99,999
- 1$100,000 to $149,999
- 11$150,000 to $199,999
- 27$200,000 to $249,999
- 23$250,000 to $299,999
- 28$300,000 to $399,999
- 40$400,000 to $499,999
- 81$500,000 to $749,999
- 17$750,000 to $999,999
- 65$1,000,000 or more

Distribution of rent paid by renters
![Distribution of rent paid by renters]()
- 12$100 to $199
- 19$200 to $299
- 40$300 to $399
- 11$400 to $499
- 26$500 to $599
- 13$600 to $699
- 8$700 to $799
- 11$800 to $899
- 12$900 to $999
- 16$1,000 to $1,249
- 66$1,250 to $1,499
- 117$1,500 to $1,999
- 59$2,000 or more

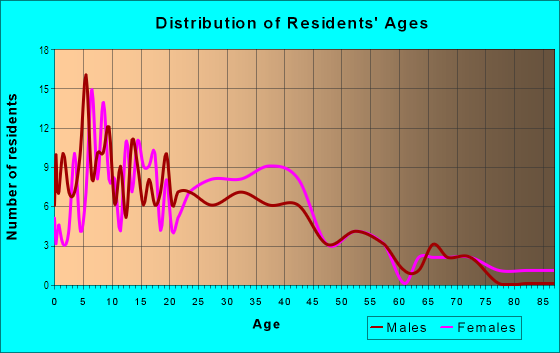
| Males: | 377 |
| Females: | 356 |
Males:
| This neighborhood: | 39.9 years |
| Whole city: | 40.1 years |
| This neighborhood: | 40.6 years |
| Whole city: | 40.4 years |
Average household size:
| Gloucester Crossing: | 8.8 people |
| Beverly: | 2.3 people |
Percentage of family households:
| Gloucester Crossing: | 41.8% |
| Beverly: | 40.5% |
| Here: | 41.1% |
| Beverly: | 47.2% |
Percentage of married-couple families with children (among all households):
| Gloucester Crossing: | 17.4% |
| Beverly: | 26.7% |
Percentage of single-mother households (among all households):
| Gloucester Crossing: | 53.3% |
| Beverly: | 11.2% |
Percentage of never married males 15 years old and over:
Percentage of never married females 15 years old and over:
| Gloucester Crossing: | 16.5% |
| Beverly: | 16.7% |
Percentage of never married females 15 years old and over:
| Gloucester Crossing: | 17.9% |
| city: | 19.4% |
Percentage of people that speak English not well or not at all:
| Gloucester Crossing: | 1.2% |
| Beverly: | 1.7% |
Percentage of people born in this state:
Percentage of people born in another U.S. state:
Percentage of native residents but born outside the U.S.:
Percentage of foreign born residents:
| Here: | 65.9% |
| Beverly: | 66.3% |
Percentage of people born in another U.S. state:
| Gloucester Crossing: | 16.8% |
| Beverly: | 22.8% |
Percentage of native residents but born outside the U.S.:
| Here: | 0.5% |
| city: | 1.1% |
Percentage of foreign born residents:
| Here: | 16.8% |
| Beverly: | 9.9% |

Owner-occupied
Renter-occupied


- Rooms in owner-occupied houses and condos in Gloucester Crossing
- 161 room
- 212 rooms
- 83 rooms
- 324 rooms
- 335 rooms
- 776 rooms
- 157 rooms
- 298 rooms
- 149+ rooms

- Rooms in renter-occupied apartments in Gloucester Crossing
- 151 room
- 262 rooms
- 623 rooms
- 364 rooms
- 665 rooms
- 266 rooms
- 237 rooms
- 548 rooms
- 09+ rooms
Owner-occupied
Renter-occupied

- Bedrooms in owner-occupied houses and condos in Gloucester Crossing
- 16no bedroom
- 431 bedroom
- 382 bedrooms
- 813 bedrooms
- 204 bedrooms
- 235+ bedrooms

- Bedrooms in renter-occupied apartments in Gloucester Crossing
- 15no bedroom
- 611 bedroom
- 482 bedrooms
- 713 bedrooms
- 164 bedrooms
- 05+ bedrooms
Average number of cars or other vehicles available in houses/condos:
Average number of cars or other vehicles available in apartments:
| This neighborhood: | 1.8 |
| Beverly: | 2.0 |
Average number of cars or other vehicles available in apartments:
| Here: | 1.2 |
| city: | 1.0 |
Percentage of units with a mortgage:
| Gloucester Crossing: | 80.3% |
| Beverly: | 75.4% |

- Year house built in Gloucester Crossing
- 02020 or later
- 252010 to 2019
- 222000 to 2009
- 441990 to 1999
- 191980 to 1989
- 181970 to 1979
- 301960 to 1969
- 431950 to 1959
- 481940 to 1949
- 1391939 or earlier

City-data.com crime index for city in 2020 (higher means more crime):
| City: | 59.0 |
| U.S. average: | 219.5 |
Travel time to work (commute)
![Travel time to work (commute)]()
- 16Less than 5 minutes
- 175 to 9 minutes
- 3810 to 14 minutes
- 2215 to 19 minutes
- 4120 to 24 minutes
- 1225 to 29 minutes
- 1530 to 34 minutes
- 235 to 39 minutes
- 1240 to 44 minutes
- 2045 to 59 minutes
- 1960 to 89 minutes
- 1390 or more minutes

Means of transportation to work
![Means of transportation to work]()
- 66.4%264Drove a car alone
- 5.5%22Carpooled
- 1.5%6Bus
- 0.3%1Subway or elevated rail
- 8.0%32Long-distance train or commuter rail
- 0.5%2Taxi
- 3.0%12Bicycle
- 4.8%19Walked
- 4.8%19Other means
- 15.1%60Worked at home

Time leaving home to go to work
![Time leaving home to go to work]()
- 412:00 a.m. to 4:59 a.m.
- 85:00 a.m. to 5:29 a.m.
- 135:30 a.m. to 5:59 a.m.
- 266:00 a.m. to 6:29 a.m.
- 346:30 a.m. to 6:59 a.m.
- 397:00 a.m. to 7:29 a.m.
- 397:30 a.m. to 7:59 a.m.
- 238:00 a.m. to 8:29 a.m.
- 188:30 a.m. to 8:59 a.m.
- 139:00 a.m. to 9:59 a.m.
- 210:00 a.m. to 10:59 a.m.
- 511:00 a.m. to 11:59 a.m.
- 812:00 p.m. to 3:59 p.m.
- 44:00 p.m. to 11:59 p.m.

Occupations of males:
- Percentage of males in management occupations (except farmers):
Here: 12.4% city: 16.9%
- Percentage of males in business and financial operations occupations:
Here: 7.3% city: 8.8%
- Percentage of males in computer and mathematical occupations:
Here: 9.8% city: 10.0%
- Percentage of males in architecture and engineering occupations:
Here: 4.3% city: 5.0%
- Percentage of males in life, physical, and social science occupations:
Here: 2.0% city: 1.5%
- Percentage of males in community and social services occupations:
Here: 5.1% city: 2.0%
- Percentage of males in legal occupations:
Here: 3.4% city: 1.6%
- Percentage of males in education, training, and library occupations:
Here: 4.2% city: 5.9%
- Percentage of males in healthcare practitioners and technical occupations:
Here: 1.6% city: 2.7%
- Percentage of males in service occupations:
Here: 13.2% city: 11.0%
- Percentage of males in sales and office occupations:
Here: 11.3% city: 14.1%
- Percentage of males in construction, extraction, and maintenance occupations:
Here: 7.2% city: 5.3%
- Percentage of males in production occupations:
Here: 1.3% city: 3.5%
- Percentage of males in transportation occupations:
Here: 15.9% city: 4.0%
- Percentage of males in material moving occupations:
Here: 3.4% city: 2.4%
Occupations of females:
- Percentage of females in management occupations (except farmers):
Here: 19.1% city: 12.8%
- Percentage of females in business and financial operations occupations:
Here: 10.1% city: 8.4%
- Percentage of females in community and social services occupations:
Here: 1.1% city: 2.6%
- Percentage of females in education, training, and library occupations:
Here: 13.9% city: 15.4%
- Percentage of females in arts, design, entertainment, sports, and media occupations:
Here: 3.1% city: 3.4%
- Percentage of females in healthcare practitioners and technical occupations:
Here: 5.5% city: 10.1%
- Percentage of females in service occupations:
Here: 12.7% city: 15.9%
- Percentage of females in sales and office occupations:
Here: 26.9% city: 20.9%
- Percentage of females in farming, fishing, and forestry occupations:
Here: 1.2% city: 0.1%
- Percentage of females in transportation occupations:
Here: 1.6% city: 1.8%
- Percentage of females in material moving occupations:
Here: 3.9% city: 0.6%
Education in this neighborhood (subdivision or community):
- Percentage of people 3 years and older in K-12 schools:
Gloucester Crossing: 20.7% Beverly: 13.5%
- Percentage of people 3 years and older in undergraduate colleges:
Gloucester Crossing: 20.7% Beverly: 9.1%
- Percentage of people 3 years and older in grad. or professional schools:
Gloucester Crossing: 0.7% Beverly: 1.7%
- Percentage of students K-12 enrolled in private schools:
Gloucester Crossing: 59.0% Beverly: 18.0%
Percentage of population below poverty level:
| Gloucester Crossing: | 16.6% |
| Beverly: | 10.5% |
Median year owner moved in (as recorded in 2022):
Median year renter moved in (as recorded in 2022):
| Gloucester Crossing: | 2006 |
| Beverly: | 2006 |
Median year renter moved in (as recorded in 2022):
| Gloucester Crossing: | 2016 |
| Beverly: | 2017 |
Percentage of married-couple families with both working:
| Gloucester Crossing: | 112.1% |
| Beverly: | 85.0% |

- 59.5%Utility gas
- 16.6%Electricity
- 11.9%Fuel oil, kerosene, etc.
- 8.8%Other fuel
- 3.3%Bottled, tank, or LP gas
Highways in this neighborhood:
State Hwy 62 (Elliott St)
Length: 0.43 miles
Direction: E-W
Address range: 122 to 245
Direction: E-W
Address range: 122 to 245
US Hwy 1 Alt (Cabot St)
Length: 0.25 miles
Directions: E-W, N-S, SE-NW
Address range: 386 to 419
Directions: E-W, N-S, SE-NW
Address range: 386 to 419
Roads and streets:
Beckford St
Length: 0.28 miles
Directions: N-S, SW-NE
Address range: 1 to 99
Directions: N-S, SW-NE
Address range: 1 to 99
Simon St
Length: 0.20 miles
Direction: E-W
Address range: 1 to 99
Direction: E-W
Address range: 1 to 99
Grant St
Length: 0.19 miles
Direction: E-W
Address range: 1 to 99
Direction: E-W
Address range: 1 to 99
Mill St
Length: 0.17 miles
Direction: E-W
Address range: 1 to 99
Direction: E-W
Address range: 1 to 99
McKay St
Length: 0.17 miles
Directions: N-S, SE-NW, SW-NE
Address range: 1 to 133
Directions: N-S, SE-NW, SW-NE
Address range: 1 to 133
Bennett St
Length: 0.16 miles
Directions: E-W, SW-NE
Address range: 1 to 99
Directions: E-W, SW-NE
Address range: 1 to 99
Gage St
Length: 0.16 miles
Directions: N-S, SE-NW, SW-NE
Address range: 1 to 99
Directions: N-S, SE-NW, SW-NE
Address range: 1 to 99
Glidden St
Length: 0.12 miles
Directions: E-W, SE-NW
Address range: 56 to 68
Directions: E-W, SE-NW
Address range: 56 to 68
Ropes St
Length: 0.08 miles
Direction: N-S
Address range: 2 to 99
Direction: N-S
Address range: 2 to 99
Blake St
Length: 0.06 miles
Direction: SW-NE
Address range: 1 to 5
Direction: SW-NE
Address range: 1 to 5
Railroad features:
Boston and Maine RR
Length: 0.49 miles
Directions: N-S, SW-NE
Directions: N-S, SW-NE