Gateway neighborhood in Newark, California (CA), 94560 detailed profile
Settings
X


Business Search - 14 Million verified businesses
Area: 0.486 square miles
Population: 1,851
Population density:
| Gateway: | 3,806 people per square mile |
| Newark: | 3,397 people per square mile |

- 86045.3%Asian
- 45524.0%Hispanic or Latino
- 42622.5%White
- 412.2%Native Hawaiian and Other
Pacific Islander - 402.1%Black
- 392.1%Two or more races
- 331.7%Some other race
- 30.2%American Indian

Median household income in 2022:
| Gateway: | $189,681 |
| Newark: | $159,465 |
Distribution of median household income
![Distribution of median household income]()
- 1Less than $10,000
- 23$10,000 to $19,999
- 47$20,000 to $29,999
- 19$30,000 to $39,999
- 103$40,000 to $49,999
- 58$50,000 to $59,999
- 65$60,000 to $74,999
- 41$75,000 to $99,999
- 49$100,000 to $124,999
- 63$125,000 to $149,999
- 115$150,000 to $199,999
- 195$200,000 or more

Distribution of owner-occupied house/condo value
![Distribution of owner-occupied house/condo value]()
- 47Less than $50,000
- 9$100,000 to $149,999
- 106$150,000 to $199,999
- 1$250,000 to $299,999
- 1$300,000 to $399,999
- 2$400,000 to $499,999
- 108$500,000 to $749,999
- 122$750,000 to $999,999
- 229$1,000,000 or more

Distribution of rent paid by renters
![Distribution of rent paid by renters]()
- 22$100 to $199
- 1$1,000 to $1,249
- 29$1,250 to $1,499
- 90$1,500 to $1,999
- 135$2,000 or more

Median rent in 2022:
| Gateway: | $1,397 |
| Newark: | $2,001 |
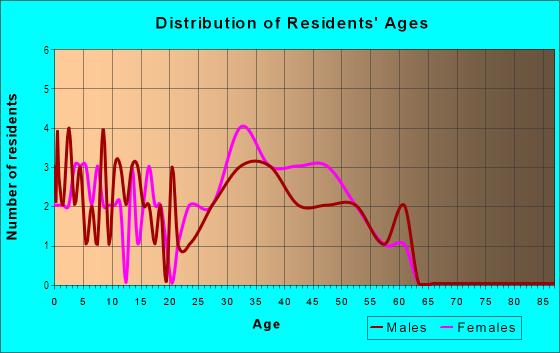
| Males: | 889 |
| Females: | 961 |
Males:
| This neighborhood: | 38.9 years |
| Whole city: | 36.4 years |
| This neighborhood: | 38.4 years |
| Whole city: | 37.8 years |
Average household size:
| Gateway: | 3.3 people |
| Newark: | 3.2 people |
Percentage of family households:
| Gateway: | 69.4% |
| Newark: | 60.0% |
| Here: | 70.7% |
| Newark: | 63.3% |
Percentage of married-couple families with children (among all households):
| Gateway: | 28.0% |
| Newark: | 26.0% |
Percentage of single-mother households (among all households):
| Gateway: | 2.7% |
| Newark: | 3.8% |
Percentage of never married males 15 years old and over:
Percentage of never married females 15 years old and over:
| Gateway: | 13.7% |
| Newark: | 19.6% |
Percentage of never married females 15 years old and over:
| Gateway: | 12.6% |
| city: | 13.1% |
Percentage of people that speak English not well or not at all:
| Gateway: | 6.1% |
| Newark: | 8.4% |
Percentage of people born in this state:
Percentage of people born in another U.S. state:
Percentage of native residents but born outside the U.S.:
Percentage of foreign born residents:
| Here: | 45.5% |
| Newark: | 48.4% |
Percentage of people born in another U.S. state:
| Gateway: | 6.7% |
| Newark: | 8.0% |
Percentage of native residents but born outside the U.S.:
| Here: | 1.8% |
| city: | 1.4% |
Percentage of foreign born residents:
| Here: | 46.0% |
| Newark: | 42.3% |

Owner-occupied
Renter-occupied


- Rooms in owner-occupied houses and condos in Gateway
- 01 room
- 02 rooms
- 173 rooms
- 1164 rooms
- 1455 rooms
- 1116 rooms
- 357 rooms
- 168 rooms
- 79+ rooms

- Rooms in renter-occupied apartments in Gateway
- 01 room
- 02 rooms
- 603 rooms
- 94 rooms
- 335 rooms
- 176 rooms
- 97 rooms
- 08 rooms
- 39+ rooms
Owner-occupied
Renter-occupied

- Bedrooms in owner-occupied houses and condos in Gateway
- 0no bedroom
- 91 bedroom
- 762 bedrooms
- 2813 bedrooms
- 744 bedrooms
- 465+ bedrooms

- Bedrooms in renter-occupied apartments in Gateway
- 0no bedroom
- 421 bedroom
- 742 bedrooms
- 473 bedrooms
- 34 bedrooms
- 535+ bedrooms
Average number of cars or other vehicles available in houses/condos:
Average number of cars or other vehicles available in apartments:
| This neighborhood: | 2.3 |
| Newark: | 2.4 |
Average number of cars or other vehicles available in apartments:
| Here: | 2.8 |
| city: | 2.2 |
Percentage of units with a mortgage:
| Gateway: | 86.7% |
| Newark: | 77.3% |
Housing prices:
- Average estimated value of detached houses in 2022 (58.7% of all units):
Gateway: $1,008,806 Newark: $1,213,373
- Average estimated value of townhouses or other attached units in 2022 (24.3% of all units):
This neighborhood: $189,606 city: $971,503

- Year house built in Gateway
- 172020 or later
- 92010 to 2019
- 362000 to 2009
- 471990 to 1999
- 1461980 to 1989
- 3671970 to 1979
- 1801960 to 1969
- 651950 to 1959
- 81940 to 1949
- 161939 or earlier

City-data.com crime index for city in 2020 (higher means more crime):
| City: | 238.2 |
| U.S. average: | 219.5 |
Travel time to work (commute)
![Travel time to work (commute)]()
- 37Less than 5 minutes
- 2075 to 9 minutes
- 26210 to 14 minutes
- 57115 to 19 minutes
- 28520 to 24 minutes
- 19325 to 29 minutes
- 40130 to 34 minutes
- 7435 to 39 minutes
- 11240 to 44 minutes
- 14345 to 59 minutes
- 28160 to 89 minutes
- 8590 or more minutes

Means of transportation to work
![Means of transportation to work]()
- 65.5%679Drove a car alone
- 14.2%147Carpooled
- 3.3%34Bus
- 2.0%21Subway or elevated rail
- 0.1%1Long-distance train or commuter rail
- 5.7%59Taxi
- 0.1%1Bicycle
- 4.0%41Walked
- 10.5%109Worked at home

Time leaving home to go to work
![Time leaving home to go to work]()
- 21812:00 a.m. to 4:59 a.m.
- 1655:00 a.m. to 5:29 a.m.
- 1625:30 a.m. to 5:59 a.m.
- 2456:00 a.m. to 6:29 a.m.
- 1546:30 a.m. to 6:59 a.m.
- 3737:00 a.m. to 7:29 a.m.
- 1747:30 a.m. to 7:59 a.m.
- 3748:00 a.m. to 8:29 a.m.
- 1258:30 a.m. to 8:59 a.m.
- 3769:00 a.m. to 9:59 a.m.
- 15710:00 a.m. to 10:59 a.m.
- 10011:00 a.m. to 11:59 a.m.
- 17312:00 p.m. to 3:59 p.m.
- 924:00 p.m. to 11:59 p.m.

Occupations of males:
- Percentage of males in management occupations (except farmers):
Here: 14.6% city: 11.8%
- Percentage of males in business and financial operations occupations:
Here: 8.2% city: 5.7%
- Percentage of males in computer and mathematical occupations:
Here: 13.4% city: 14.4%
- Percentage of males in architecture and engineering occupations:
Here: 7.8% city: 8.6%
- Percentage of males in life, physical, and social science occupations:
Here: 1.3% city: 1.0%
- Percentage of males in education, training, and library occupations:
Here: 1.5% city: 1.3%
- Percentage of males in arts, design, entertainment, sports, and media occupations:
Here: 3.1% city: 1.2%
- Percentage of males in healthcare practitioners and technical occupations:
Here: 1.2% city: 3.0%
- Percentage of males in service occupations:
Here: 13.8% city: 11.2%
- Percentage of males in sales and office occupations:
Here: 18.7% city: 13.5%
- Percentage of males in farming, fishing, and forestry occupations:
Here: 1.7% city: 0.4%
- Percentage of males in construction, extraction, and maintenance occupations:
Here: 2.2% city: 7.8%
- Percentage of males in production occupations:
Here: 9.2% city: 6.8%
- Percentage of males in transportation occupations:
Here: 2.4% city: 4.6%
- Percentage of males in material moving occupations:
Here: 1.5% city: 3.5%
Occupations of females:
- Percentage of females in management occupations (except farmers):
Here: 4.4% city: 13.4%
- Percentage of females in business and financial operations occupations:
Here: 14.5% city: 9.9%
- Percentage of females in computer and mathematical occupations:
Here: 11.0% city: 7.6%
- Percentage of females in architecture and engineering occupations:
Here: 4.4% city: 2.6%
- Percentage of females in life, physical, and social science occupations:
Here: 2.0% city: 2.2%
- Percentage of females in legal occupations:
Here: 1.0% city: 1.3%
- Percentage of females in education, training, and library occupations:
Here: 13.1% city: 5.6%
- Percentage of females in arts, design, entertainment, sports, and media occupations:
Here: 1.8% city: 1.8%
- Percentage of females in healthcare practitioners and technical occupations:
Here: 6.0% city: 8.0%
- Percentage of females in service occupations:
Here: 18.7% city: 17.1%
- Percentage of females in sales and office occupations:
Here: 18.8% city: 21.5%
- Percentage of females in production occupations:
Here: 3.6% city: 3.1%
- Percentage of females in material moving occupations:
Here: 8.0% city: 2.9%
Education in this neighborhood (subdivision or community):
- Percentage of people 3 years and older in K-12 schools:
Gateway: 13.7% Newark: 13.6%
- Percentage of people 3 years and older in undergraduate colleges:
Gateway: 15.3% Newark: 5.2%
- Percentage of people 3 years and older in grad. or professional schools:
Gateway: 1.3% Newark: 1.6%
- Percentage of students K-12 enrolled in private schools:
Gateway: 54.6% Newark: 17.5%
Percentage of population below poverty level:
| Gateway: | 4.7% |
| Newark: | 4.0% |
Median year owner moved in (as recorded in 2022):
Median year renter moved in (as recorded in 2022):
| Gateway: | 2007 |
| Newark: | 2009 |
Median year renter moved in (as recorded in 2022):
| Gateway: | 2017 |
| Newark: | 2016 |
Percentage of married-couple families with both working:
| Gateway: | 91.0% |
| Newark: | 79.2% |

- 68.6%Utility gas
- 27.2%Electricity
- 1.9%Solar energy
- 1.7%No fuel used
- 0.6%Bottled, tank, or LP gas
Limited-access highways (interstate or state) in this neighborhood:
State Hwy 84
Length: 0.82 miles
Direction: SW-NE
Direction: SW-NE
Roads and streets:
Jarvis Ave
Length: 1.74 miles
Directions: E-W, N-S, SE-NW, SW-NE
Address range: 6700 to 8099
Directions: E-W, N-S, SE-NW, SW-NE
Address range: 6700 to 8099
Thornton Ave
Length: 1.48 miles
Directions: N-S, SE-NW
Directions: N-S, SE-NW
Gateway Blvd
Length: 0.75 miles
Directions: N-S, SE-NW, SW-NE
Address range: 7000 to 7199
Directions: N-S, SE-NW, SW-NE
Address range: 7000 to 7199
Kiote Dr
Length: 0.44 miles
Directions: N-S, SE-NW, SW-NE
Address range: 36100 to 36229
Directions: N-S, SE-NW, SW-NE
Address range: 36100 to 36229
Fircrest St
Length: 0.28 miles
Directions: E-W, SE-NW, SW-NE
Address range: 7000 to 35399
Directions: E-W, SE-NW, SW-NE
Address range: 7000 to 35399
Overlake Pl
Length: 0.13 miles
Direction: SW-NE
Address range: 6500 to 6699
Direction: SW-NE
Address range: 6500 to 6699
Haley St
Length: 0.02 miles
Directions: E-W, SE-NW
Directions: E-W, SE-NW
Railroad features:
Union Pacific RR
Length: 0.37 miles
Direction: N-S
Direction: N-S