Floresta Gardens neighborhood in San Leandro, California (CA), 94577, 94578 detailed profile
Settings
X


Business Search - 14 Million verified businesses
Area: 0.149 square miles
Population: 722
Population density:
| Floresta Gardens: | 4,854 people per square mile |
| San Leandro: | 6,610 people per square mile |

- 50942.1%Black
- 33627.8%Hispanic or Latino
- 30925.5%Asian
- 322.6%Two or more races
- 221.8%White
- 20.2%Native Hawaiian and Other
Pacific Islander

Distribution of median household income
![Distribution of median household income]()
- 6Less than $10,000
- 283$10,000 to $19,999
- 10$20,000 to $29,999
- 156$30,000 to $39,999
- 27$40,000 to $49,999
- 18$50,000 to $59,999
- 8$60,000 to $74,999
- 42$75,000 to $99,999
- 18$100,000 to $124,999
- 10$125,000 to $149,999
- 22$150,000 to $199,999
- 22$200,000 or more

Distribution of owner-occupied house/condo value
![Distribution of owner-occupied house/condo value]()
- 4$50,000 to $99,999
- 4$300,000 to $399,999
- 8$400,000 to $499,999
- 50$500,000 to $749,999
- 43$750,000 to $999,999

Distribution of rent paid by renters
![Distribution of rent paid by renters]()
- 179$200 to $299
- 20$600 to $699
- 63$1,000 to $1,249
- 244$1,250 to $1,499
- 17$1,500 to $1,999
- 142$2,000 or more

Median rent in 2022:
| Floresta Gardens: | $2,197 |
| San Leandro: | $1,893 |
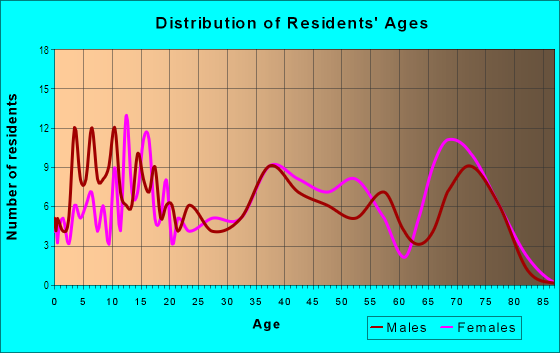
| Males: | 356 |
| Females: | 366 |
Males:
| This neighborhood: | 35.4 years |
| Whole city: | 40.3 years |
| This neighborhood: | 37.6 years |
| Whole city: | 45.2 years |
Average household size:
| Floresta Gardens: | 3.0 people |
| San Leandro: | 2.9 people |
Percentage of family households:
| Floresta Gardens: | 64.1% |
| San Leandro: | 44.4% |
| Here: | 54.3% |
| San Leandro: | 49.6% |
Percentage of married-couple families with children (among all households):
| Floresta Gardens: | 21.5% |
| San Leandro: | 26.2% |
Percentage of single-mother households (among all households):
| Floresta Gardens: | 1.4% |
| San Leandro: | 7.1% |
Percentage of never married males 15 years old and over:
Percentage of never married females 15 years old and over:
| Floresta Gardens: | 27.6% |
| San Leandro: | 18.2% |
Percentage of never married females 15 years old and over:
| Floresta Gardens: | 21.7% |
| city: | 16.0% |
Percentage of people that speak English not well or not at all:
| Floresta Gardens: | 17.4% |
| San Leandro: | 12.0% |
Percentage of people born in this state:
Percentage of people born in another U.S. state:
Percentage of native residents but born outside the U.S.:
Percentage of foreign born residents:
| Here: | 49.5% |
| San Leandro: | 44.1% |
Percentage of people born in another U.S. state:
| Floresta Gardens: | 6.1% |
| San Leandro: | 9.8% |
Percentage of native residents but born outside the U.S.:
| Here: | 0.0% |
| city: | 1.7% |
Percentage of foreign born residents:
| Here: | 44.4% |
| San Leandro: | 44.4% |

Owner-occupied
Renter-occupied


- Rooms in owner-occupied houses and condos in Floresta Gardens
- 01 room
- 02 rooms
- 63 rooms
- 284 rooms
- 315 rooms
- 296 rooms
- 57 rooms
- 68 rooms
- 09+ rooms

- Rooms in renter-occupied apartments in Floresta Gardens
- 541 room
- 1512 rooms
- 143 rooms
- 264 rooms
- 55 rooms
- 116 rooms
- 07 rooms
- 08 rooms
- 09+ rooms
Owner-occupied
Renter-occupied

- Bedrooms in owner-occupied houses and condos in Floresta Gardens
- 0no bedroom
- 11 bedroom
- 92 bedrooms
- 843 bedrooms
- 104 bedrooms
- 15+ bedrooms

- Bedrooms in renter-occupied apartments in Floresta Gardens
- 73no bedroom
- 201 bedroom
- 182 bedrooms
- 233 bedrooms
- 04 bedrooms
- 05+ bedrooms
Average number of cars or other vehicles available in houses/condos:
Average number of cars or other vehicles available in apartments:
| This neighborhood: | 2.5 |
| San Leandro: | 2.2 |
Average number of cars or other vehicles available in apartments:
| Here: | 1.4 |
| city: | 1.3 |
Percentage of units with a mortgage:
| Floresta Gardens: | 81.8% |
| San Leandro: | 63.4% |
Average estimated value of detached houses in 2022 (57.7% of all units):
| Floresta Gardens: | $742,611 |
| California: | $988,808 |

- Year house built in Floresta Gardens
- 02020 or later
- 62010 to 2019
- 52000 to 2009
- 81990 to 1999
- 371980 to 1989
- 2131970 to 1979
- 201960 to 1969
- 721950 to 1959
- 201940 to 1949
- 21939 or earlier

City-data.com crime index for city in 2020 (higher means more crime):
| City: | 374.8 |
| U.S. average: | 219.5 |
Travel time to work (commute)
![Travel time to work (commute)]()
- 185 to 9 minutes
- 2910 to 14 minutes
- 3015 to 19 minutes
- 1720 to 24 minutes
- 1425 to 29 minutes
- 5430 to 34 minutes
- 435 to 39 minutes
- 2840 to 44 minutes
- 5045 to 59 minutes
- 1460 to 89 minutes
- 290 or more minutes

Means of transportation to work
![Means of transportation to work]()
- 77.0%274Drove a car alone
- 10.4%37Carpooled
- 4.5%16Bus
- 2.2%8Subway or elevated rail
- 11.8%42Other means
- 5.1%18Worked at home

Time leaving home to go to work
![Time leaving home to go to work]()
- 3012:00 a.m. to 4:59 a.m.
- 185:00 a.m. to 5:29 a.m.
- 125:30 a.m. to 5:59 a.m.
- 266:00 a.m. to 6:29 a.m.
- 236:30 a.m. to 6:59 a.m.
- 247:00 a.m. to 7:29 a.m.
- 147:30 a.m. to 7:59 a.m.
- 98:00 a.m. to 8:29 a.m.
- 58:30 a.m. to 8:59 a.m.
- 159:00 a.m. to 9:59 a.m.
- 1610:00 a.m. to 10:59 a.m.
- 1011:00 a.m. to 11:59 a.m.
- 3512:00 p.m. to 3:59 p.m.
- 174:00 p.m. to 11:59 p.m.

Occupations of males:
- Percentage of males in management occupations (except farmers):
Here: 3.6% city: 9.9%
- Percentage of males in business and financial operations occupations:
Here: 6.9% city: 4.3%
- Percentage of males in computer and mathematical occupations:
Here: 6.3% city: 6.7%
- Percentage of males in legal occupations:
Here: 1.3% city: 0.7%
- Percentage of males in arts, design, entertainment, sports, and media occupations:
Here: 1.7% city: 1.5%
- Percentage of males in healthcare practitioners and technical occupations:
Here: 5.7% city: 2.2%
- Percentage of males in service occupations:
Here: 16.4% city: 14.6%
- Percentage of males in sales and office occupations:
Here: 30.2% city: 14.8%
- Percentage of males in construction, extraction, and maintenance occupations:
Here: 17.8% city: 10.0%
- Percentage of males in production occupations:
Here: 1.6% city: 7.8%
- Percentage of males in transportation occupations:
Here: 1.7% city: 7.3%
- Percentage of males in material moving occupations:
Here: 5.9% city: 6.8%
Occupations of females:
- Percentage of females in management occupations (except farmers):
Here: 11.0% city: 9.2%
- Percentage of females in business and financial operations occupations:
Here: 4.1% city: 7.3%
- Percentage of females in healthcare practitioners and technical occupations:
Here: 6.4% city: 6.5%
- Percentage of females in service occupations:
Here: 45.1% city: 23.3%
- Percentage of females in sales and office occupations:
Here: 16.5% city: 26.6%
- Percentage of females in construction, extraction, and maintenance occupations:
Here: 1.5% city: 0.6%
- Percentage of females in production occupations:
Here: 5.8% city: 5.3%
- Percentage of females in material moving occupations:
Here: 6.7% city: 3.5%
Education in this neighborhood (subdivision or community):
- Percentage of people 3 years and older in K-12 schools:
Floresta Gardens: 20.1% San Leandro: 14.4%
- Percentage of people 3 years and older in undergraduate colleges:
Floresta Gardens: 6.2% San Leandro: 5.5%
- Percentage of people 3 years and older in grad. or professional schools:
Floresta Gardens: 22.2% San Leandro: 1.6%
- Percentage of students K-12 enrolled in private schools:
Floresta Gardens: 19.4% San Leandro: 9.9%
Percentage of population below poverty level:
| Floresta Gardens: | 13.4% |
| San Leandro: | 7.4% |
Median year renter moved in (as recorded in 2022):
| Floresta Gardens: | 2014 |
| San Leandro: | 2018 |
Percentage of married-couple families with both working:
| Floresta Gardens: | 73.0% |
| San Leandro: | 62.2% |

- 46.4%Utility gas
- 43.9%Electricity
- 5.6%No fuel used
- 2.7%Bottled, tank, or LP gas
- 1.4%Solar energy
Roads and streets:
Floresta Blvd
Length: 0.77 miles
Directions: E-W, SW-NE
Address range: 646 to 1436
Directions: E-W, SW-NE
Address range: 646 to 1436
Figueroa Dr
Length: 0.55 miles
Directions: E-W, N-S, SE-NW, SW-NE
Address range: 800 to 3699
Directions: E-W, N-S, SE-NW, SW-NE
Address range: 800 to 3699
Portola Dr
Length: 0.44 miles
Directions: E-W, N-S, SW-NE
Address range: 700 to 999
Directions: E-W, N-S, SW-NE
Address range: 700 to 999
Monterey Blvd
Length: 0.38 miles
Direction: SE-NW
Address range: 3400 to 3699
Direction: SE-NW
Address range: 3400 to 3699
Arguello Dr
Length: 0.37 miles
Directions: E-W, SW-NE
Address range: 700 to 999
Directions: E-W, SW-NE
Address range: 700 to 999
Carrillo Dr
Length: 0.31 miles
Directions: N-S, SE-NW
Address range: 3400 to 3699
Directions: N-S, SE-NW
Address range: 3400 to 3699
del Monte Way
Length: 0.29 miles
Direction: SE-NW
Address range: 3400 to 3699
Direction: SE-NW
Address range: 3400 to 3699
Barri Dr
Length: 0.29 miles
Direction: SW-NE
Address range: 700 to 899
Direction: SW-NE
Address range: 700 to 899
Fremont Ave
Length: 0.25 miles
Directions: E-W, SE-NW, SW-NE
Address range: 600 to 899
Directions: E-W, SE-NW, SW-NE
Address range: 600 to 899
Chico Dr
Length: 0.24 miles
Directions: E-W, SW-NE
Address range: 700 to 899
Directions: E-W, SW-NE
Address range: 700 to 899
Moraga Dr
Length: 0.22 miles
Directions: E-W, SW-NE
Address range: 700 to 899
Directions: E-W, SW-NE
Address range: 700 to 899
Sutter St
Length: 0.18 miles
Direction: SE-NW
Direction: SE-NW
Alvarado St
Length: 0.08 miles
Directions: N-S, SE-NW
Address range: 3400 to 3499
Directions: N-S, SE-NW
Address range: 3400 to 3499
Carrillo Way
Length: 0.05 miles
Directions: E-W, SW-NE
Address range: 900 to 999
Directions: E-W, SW-NE
Address range: 900 to 999
del Rio Cir
Length: 0.04 miles
Direction: SE-NW
Address range: 3400 to 3499
Direction: SE-NW
Address range: 3400 to 3499
del Valle Cir
Length: 0.04 miles
Direction: SE-NW
Address range: 3400 to 3499
Direction: SE-NW
Address range: 3400 to 3499
del Campo Cir
Length: 0.04 miles
Direction: SE-NW
Address range: 3400 to 3499
Direction: SE-NW
Address range: 3400 to 3499
del Mar Cir
Length: 0.04 miles
Direction: SE-NW
Address range: 3400 to 3499
Direction: SE-NW
Address range: 3400 to 3499
Interstate 880 N
Length: 0.01 miles
Direction: SE-NW
Direction: SE-NW