Farelly Pond (Pond District) neighborhood in San Leandro, California (CA), 94577, 94603 detailed profile
Settings
X


Business Search - 14 Million verified businesses
Area: 0.114 square miles
Population: 1,641
Population density:
| Farelly Pond (Pond District): | 14,343 people per square mile |
| San Leandro: | 6,610 people per square mile |

- 79442.9%Hispanic or Latino
- 43423.4%White
- 1749.4%Asian
- 1749.4%Native Hawaiian and Other
Pacific Islander - 1588.5%Black
- 643.5%Two or more races
- 472.5%Some other race
- 60.3%American Indian

Median household income in 2022:
| Farelly Pond (Pond District): | $112,369 |
| San Leandro: | $92,651 |
Distribution of median household income
![Distribution of median household income]()
- 9Less than $10,000
- 43$10,000 to $19,999
- 72$20,000 to $29,999
- 51$30,000 to $39,999
- 68$40,000 to $49,999
- 25$50,000 to $59,999
- 41$60,000 to $74,999
- 77$75,000 to $99,999
- 21$100,000 to $124,999
- 56$125,000 to $149,999
- 106$150,000 to $199,999
- 125$200,000 or more

Distribution of owner-occupied house/condo value
![Distribution of owner-occupied house/condo value]()
- 12Less than $50,000
- 15$50,000 to $99,999
- 10$100,000 to $149,999
- 14$150,000 to $199,999
- 60$200,000 to $249,999
- 19$250,000 to $299,999
- 15$300,000 to $399,999
- 54$400,000 to $499,999
- 122$500,000 to $749,999
- 147$750,000 to $999,999
- 40$1,000,000 or more

Distribution of rent paid by renters
![Distribution of rent paid by renters]()
- 14Less than $100
- 67$200 to $299
- 6$300 to $399
- 14$400 to $499
- 50$500 to $599
- 2$600 to $699
- 12$700 to $799
- 29$800 to $899
- 20$900 to $999
- 87$1,000 to $1,249
- 70$1,250 to $1,499
- 58$1,500 to $1,999
- 61$2,000 or more

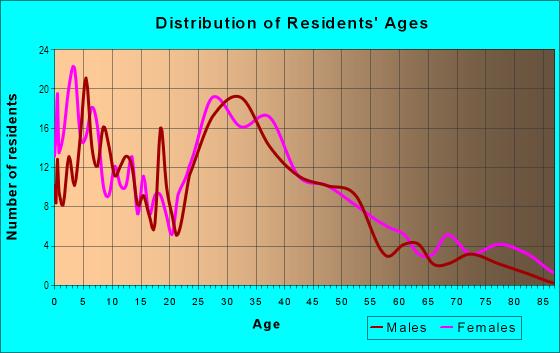
| Males: | 722 |
| Females: | 918 |
Males:
| This neighborhood: | 39.6 years |
| Whole city: | 40.3 years |
| This neighborhood: | 41.6 years |
| Whole city: | 45.2 years |
Average household size:
| Farelly Pond (Pond District): | 2.9 people |
| San Leandro: | 2.9 people |
Percentage of family households:
| Farelly Pond (Pond District): | 66.5% |
| San Leandro: | 44.4% |
| Here: | 62.3% |
| San Leandro: | 49.6% |
Percentage of married-couple families with children (among all households):
| Farelly Pond (Pond District): | 31.6% |
| San Leandro: | 26.2% |
Percentage of single-mother households (among all households):
| Farelly Pond (Pond District): | 1.9% |
| San Leandro: | 7.1% |
Percentage of never married males 15 years old and over:
Percentage of never married females 15 years old and over:
| Farelly Pond (Pond District): | 15.4% |
| San Leandro: | 18.2% |
Percentage of never married females 15 years old and over:
| Farelly Pond (Pond District): | 19.7% |
| city: | 16.0% |
Percentage of people that speak English not well or not at all:
| Farelly Pond (Pond District): | 11.2% |
| San Leandro: | 12.0% |
Percentage of people born in this state:
Percentage of people born in another U.S. state:
Percentage of native residents but born outside the U.S.:
Percentage of foreign born residents:
| Here: | 52.6% |
| San Leandro: | 44.1% |
Percentage of people born in another U.S. state:
| Farelly Pond (Pond District): | 13.7% |
| San Leandro: | 9.8% |
Percentage of native residents but born outside the U.S.:
| Here: | 3.8% |
| city: | 1.7% |
Percentage of foreign born residents:
| Here: | 30.4% |
| San Leandro: | 44.4% |

Owner-occupied
Renter-occupied


- Rooms in owner-occupied houses and condos in Farelly Pond <
> - 71 room
- 62 rooms
- 113 rooms
- 474 rooms
- 825 rooms
- 816 rooms
- 227 rooms
- 538 rooms
- 419+ rooms

- Rooms in renter-occupied apartments in Farelly Pond <
> - 111 room
- 92 rooms
- 833 rooms
- 634 rooms
- 865 rooms
- 126 rooms
- 197 rooms
- 318 rooms
- 79+ rooms
Owner-occupied
Renter-occupied

- Bedrooms in owner-occupied houses and condos in Farelly Pond <
> - 7no bedroom
- 61 bedroom
- 1452 bedrooms
- 1073 bedrooms
- 224 bedrooms
- 205+ bedrooms

- Bedrooms in renter-occupied apartments in Farelly Pond <
> - 11no bedroom
- 1201 bedroom
- 1232 bedrooms
- 283 bedrooms
- 74 bedrooms
- 75+ bedrooms
Average number of cars or other vehicles available in houses/condos:
Average number of cars or other vehicles available in apartments:
| This neighborhood: | 2.0 |
| San Leandro: | 2.2 |
Average number of cars or other vehicles available in apartments:
| Here: | 2.0 |
| city: | 1.3 |
Percentage of units with a mortgage:
| Farelly Pond (Pond District): | 74.1% |
| San Leandro: | 63.4% |
Average estimated value of detached houses in 2022 (66.3% of all units):
| Farelly Pond (Pond District): | $812,666 |
| California: | $988,808 |

- Year house built in Farelly Pond <
> - 282020 or later
- 152010 to 2019
- 1302000 to 2009
- 171990 to 1999
- 151980 to 1989
- 231970 to 1979
- 161960 to 1969
- 711950 to 1959
- 2441940 to 1949
- 2081939 or earlier

City-data.com crime index for city in 2020 (higher means more crime):
| City: | 374.8 |
| U.S. average: | 219.5 |
Travel time to work (commute)
![Travel time to work (commute)]()
- 3Less than 5 minutes
- 505 to 9 minutes
- 5010 to 14 minutes
- 6115 to 19 minutes
- 15120 to 24 minutes
- 4525 to 29 minutes
- 10130 to 34 minutes
- 4935 to 39 minutes
- 6140 to 44 minutes
- 11545 to 59 minutes
- 11260 to 89 minutes
- 1990 or more minutes

Means of transportation to work
![Means of transportation to work]()
- 47.5%459Drove a car alone
- 35.6%344Carpooled
- 1.1%11Bus
- 5.0%48Subway or elevated rail
- 2.2%21Long-distance train or commuter rail
- 2.2%21Light rail, streetcar or trolley
- 1.8%17Taxi
- 0.4%4Motorcycle
- 0.4%4Bicycle
- 3.9%38Walked
- 0.3%3Other means
- 9.7%94Worked at home

Time leaving home to go to work
![Time leaving home to go to work]()
- 5612:00 a.m. to 4:59 a.m.
- 555:00 a.m. to 5:29 a.m.
- 205:30 a.m. to 5:59 a.m.
- 576:00 a.m. to 6:29 a.m.
- 746:30 a.m. to 6:59 a.m.
- 1057:00 a.m. to 7:29 a.m.
- 897:30 a.m. to 7:59 a.m.
- 678:00 a.m. to 8:29 a.m.
- 838:30 a.m. to 8:59 a.m.
- 879:00 a.m. to 9:59 a.m.
- 2910:00 a.m. to 10:59 a.m.
- 1911:00 a.m. to 11:59 a.m.
- 4412:00 p.m. to 3:59 p.m.
- 484:00 p.m. to 11:59 p.m.

Occupations of males:
- Percentage of males in management occupations (except farmers):
Here: 13.9% city: 9.9%
- Percentage of males in business and financial operations occupations:
Here: 1.9% city: 4.3%
- Percentage of males in computer and mathematical occupations:
Here: 6.6% city: 6.7%
- Percentage of males in community and social services occupations:
Here: 3.1% city: 1.7%
- Percentage of males in education, training, and library occupations:
Here: 3.1% city: 3.0%
- Percentage of males in arts, design, entertainment, sports, and media occupations:
Here: 1.3% city: 1.5%
- Percentage of males in service occupations:
Here: 6.5% city: 14.6%
- Percentage of males in sales and office occupations:
Here: 18.3% city: 14.8%
- Percentage of males in construction, extraction, and maintenance occupations:
Here: 18.5% city: 10.0%
- Percentage of males in transportation occupations:
Here: 12.7% city: 7.3%
- Percentage of males in material moving occupations:
Here: 11.9% city: 6.8%
Occupations of females:
- Percentage of females in business and financial operations occupations:
Here: 8.6% city: 7.3%
- Percentage of females in computer and mathematical occupations:
Here: 6.6% city: 2.3%
- Percentage of females in life, physical, and social science occupations:
Here: 2.1% city: 1.4%
- Percentage of females in community and social services occupations:
Here: 6.1% city: 1.8%
- Percentage of females in legal occupations:
Here: 3.7% city: 1.5%
- Percentage of females in education, training, and library occupations:
Here: 11.5% city: 6.9%
- Percentage of females in arts, design, entertainment, sports, and media occupations:
Here: 4.8% city: 2.2%
- Percentage of females in service occupations:
Here: 39.5% city: 23.3%
- Percentage of females in sales and office occupations:
Here: 15.2% city: 26.6%
Percentage of people 16-64 in Armed Forces:
| Farelly Pond (Pond District): | 0.2% |
| San Leandro: | 0.1% |
Education in this neighborhood (subdivision or community):
- Percentage of people 3 years and older in K-12 schools:
Farelly Pond (Pond District): 20.0% San Leandro: 14.4%
- Percentage of people 3 years and older in undergraduate colleges:
Farelly Pond (Pond District): 8.7% San Leandro: 5.5%
- Percentage of people 3 years and older in grad. or professional schools:
Farelly Pond (Pond District): 3.6% San Leandro: 1.6%
- Percentage of students K-12 enrolled in private schools:
Farelly Pond (Pond District): 43.6% San Leandro: 9.9%
Percentage of population below poverty level:
| Farelly Pond (Pond District): | 8.8% |
| San Leandro: | 7.4% |
Median year owner moved in (as recorded in 2022):
| Farelly Pond (Pond District): | 2006 |
| San Leandro: | 2006 |
Percentage of married-couple families with both working:
| Farelly Pond (Pond District): | 67.0% |
| San Leandro: | 62.2% |

- 62.2%Utility gas
- 18.9%Electricity
- 5.1%Fuel oil, kerosene, etc.
- 3.9%No fuel used
- 3.3%Bottled, tank, or LP gas
- 2.8%Solar energy
- 2.2%Wood
- 1.5%Coal or coke
Highways in this neighborhood:
State Hwy 185 (E 14th St)
Length: 0.24 miles
Direction: SE-NW
Address range: 15 to 10998
Direction: SE-NW
Address range: 15 to 10998
Roads and streets:
W Broadmoor Blvd
Length: 0.50 miles
Direction: SW-NE
Address range: 100 to 499
Direction: SW-NE
Address range: 100 to 499
Bristol Blvd
Length: 0.42 miles
Direction: SW-NE
Address range: 100 to 499
Direction: SW-NE
Address range: 100 to 499
Farrelly Dr
Length: 0.42 miles
Directions: E-W, SW-NE
Address range: 100 to 399
Directions: E-W, SW-NE
Address range: 100 to 399
Lexington Ave
Length: 0.37 miles
Direction: SW-NE
Address range: 100 to 399
Direction: SW-NE
Address range: 100 to 399
Bowling Green St
Length: 0.36 miles
Direction: SW-NE
Address range: 100 to 399
Direction: SW-NE
Address range: 100 to 399
Suffolk Dr
Length: 0.36 miles
Direction: SW-NE
Address range: 100 to 399
Direction: SW-NE
Address range: 100 to 399
Pershing Dr
Length: 0.23 miles
Direction: SE-NW
Address range: 100 to 198
Direction: SE-NW
Address range: 100 to 198
Pontiac St
Length: 0.18 miles
Direction: SE-NW
Address range: 100 to 199
Direction: SE-NW
Address range: 100 to 199
Dorchester Ave
Length: 0.18 miles
Directions: E-W, N-S, SE-NW
Address range: 1 to 199
Directions: E-W, N-S, SE-NW
Address range: 1 to 199
Apricot St
Length: 0.12 miles
Direction: SE-NW
Address range: 11000 to 11099
Direction: SE-NW
Address range: 11000 to 11099
E 14th
Length: 0.10 miles
Directions: E-W, SE-NW
Directions: E-W, SE-NW
Broadmoor
Length: 0.01 miles
Direction: SW-NE
Direction: SW-NE