Ericsson neighborhood in Minneapolis, Minnesota (MN), 55406, 55407 detailed profile
Settings
X


Business Search - 14 Million verified businesses
Area: 0.910 square miles
Population: 3,856
Population density:
| Ericsson: | 4,236 people per square mile |
| Minneapolis: | 7,744 people per square mile |

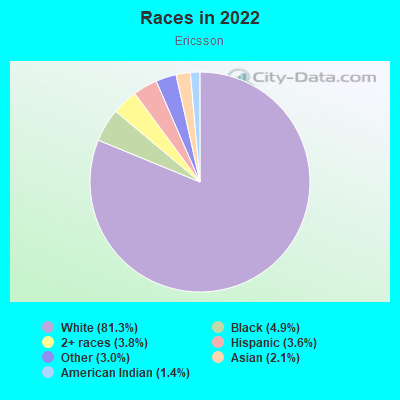
- 3,31881.3%White
- 2014.9%Black
- 1533.8%Two or more races
- 1453.6%Hispanic or Latino
- 1213.0%Some other race
- 852.1%Asian
- 571.4%American Indian
Median household income in 2022:
| Ericsson: | $100,457 |
| Minneapolis: | $74,473 |
Distribution of median household income
![Distribution of median household income]()
- 109Less than $10,000
- 138$10,000 to $19,999
- 92$20,000 to $29,999
- 152$30,000 to $39,999
- 134$40,000 to $49,999
- 70$50,000 to $59,999
- 215$60,000 to $74,999
- 224$75,000 to $99,999
- 161$100,000 to $124,999
- 231$125,000 to $149,999
- 207$150,000 to $199,999
- 345$200,000 or more

Distribution of owner-occupied house/condo value
![Distribution of owner-occupied house/condo value]()
- 254Less than $50,000
- 215$50,000 to $99,999
- 224$100,000 to $149,999
- 223$150,000 to $199,999
- 129$200,000 to $249,999
- 191$250,000 to $299,999
- 436$300,000 to $399,999
- 337$400,000 to $499,999
- 221$500,000 to $749,999
- 37$750,000 to $999,999
- 150$1,000,000 or more

Distribution of rent paid by renters
![Distribution of rent paid by renters]()
- 43$100 to $199
- 102$500 to $599
- 107$600 to $699
- 377$700 to $799
- 39$800 to $899
- 140$900 to $999
- 35$1,000 to $1,249
- 148$1,250 to $1,499
- 105$1,500 to $1,999
- 210$2,000 or more

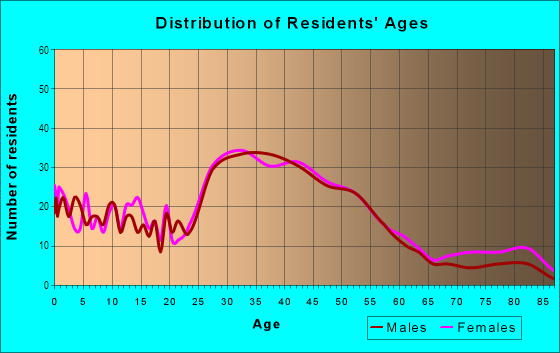
| Males: | 1,962 |
| Females: | 1,893 |
Males:
| This neighborhood: | 39.1 years |
| Whole city: | 33.3 years |
| This neighborhood: | 41.3 years |
| Whole city: | 33.2 years |
Average household size:
| Ericsson: | 4.1 people |
| Minneapolis: | 2.1 people |
Percentage of family households:
| Ericsson: | 47.0% |
| Minneapolis: | 34.1% |
| Here: | 51.2% |
| Minneapolis: | 29.8% |
Percentage of married-couple families with children (among all households):
| Ericsson: | 36.7% |
| Minneapolis: | 31.8% |
Percentage of single-mother households (among all households):
| Ericsson: | 5.8% |
| Minneapolis: | 10.5% |
Percentage of never married males 15 years old and over:
Percentage of never married females 15 years old and over:
| Ericsson: | 15.7% |
| Minneapolis: | 27.0% |
Percentage of never married females 15 years old and over:
| Ericsson: | 16.2% |
| city: | 25.4% |
Percentage of people that speak English not well or not at all:
| Ericsson: | 1.1% |
| Minneapolis: | 3.8% |
Percentage of people born in this state:
Percentage of people born in another U.S. state:
Percentage of native residents but born outside the U.S.:
Percentage of foreign born residents:
| Here: | 57.7% |
| Minneapolis: | 51.9% |
Percentage of people born in another U.S. state:
| Ericsson: | 35.5% |
| Minneapolis: | 31.8% |
Percentage of native residents but born outside the U.S.:
| Here: | 0.5% |
| city: | 1.5% |
Percentage of foreign born residents:
| Here: | 6.2% |
| Minneapolis: | 14.7% |
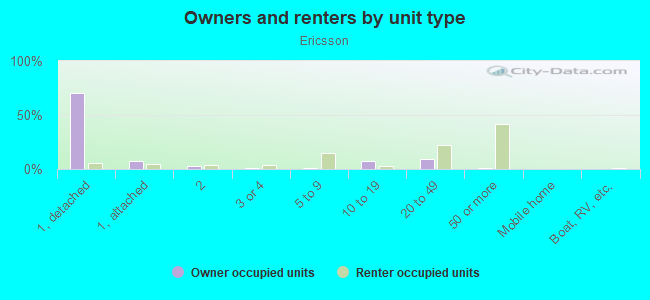
Owner-occupied
Renter-occupied

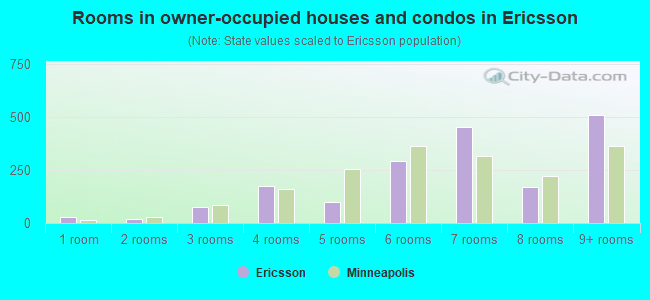
- Rooms in owner-occupied houses and condos in Ericsson
- 271 room
- 182 rooms
- 733 rooms
- 1744 rooms
- 1005 rooms
- 2916 rooms
- 4507 rooms
- 1678 rooms
- 5089+ rooms
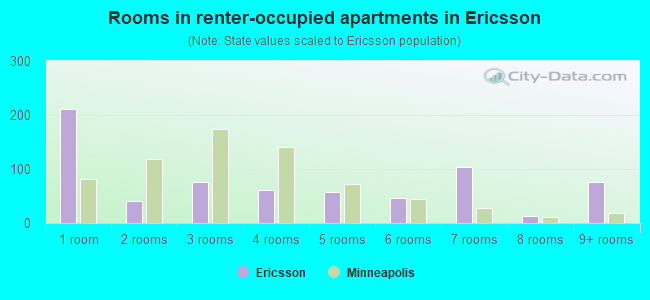
- Rooms in renter-occupied apartments in Ericsson
- 2121 room
- 402 rooms
- 763 rooms
- 614 rooms
- 585 rooms
- 476 rooms
- 1047 rooms
- 138 rooms
- 769+ rooms
Owner-occupied
Renter-occupied
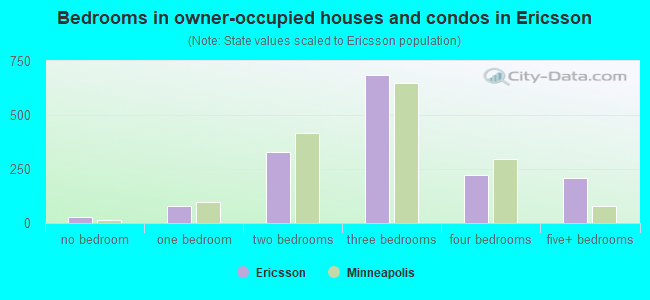
- Bedrooms in owner-occupied houses and condos in Ericsson
- 27no bedroom
- 811 bedroom
- 3312 bedrooms
- 6843 bedrooms
- 2214 bedrooms
- 2105+ bedrooms
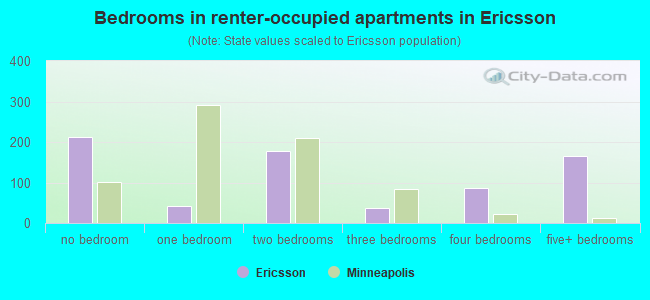
- Bedrooms in renter-occupied apartments in Ericsson
- 212no bedroom
- 411 bedroom
- 1792 bedrooms
- 363 bedrooms
- 864 bedrooms
- 1665+ bedrooms
Average number of cars or other vehicles available in houses/condos:
Average number of cars or other vehicles available in apartments:
| This neighborhood: | 1.1 |
| Minneapolis: | 1.6 |
Average number of cars or other vehicles available in apartments:
| Here: | |
| city: |
Percentage of units with a mortgage:
| Ericsson: | 70.0% |
| Minneapolis: | 71.8% |
Average estimated value of detached houses in 2022 (85.1% of all units):
| Ericsson: | $400,849 |
| Minnesota: | $374,552 |
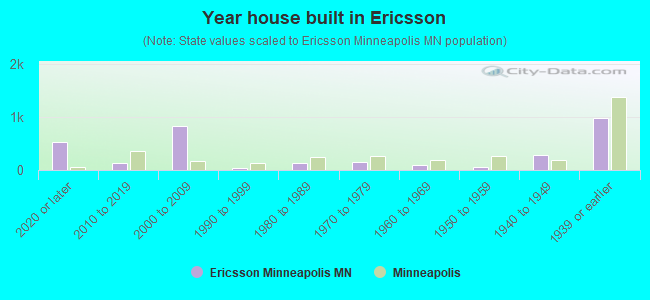
- Year house built in Ericsson
- 5192020 or later
- 1302010 to 2019
- 8242000 to 2009
- 401990 to 1999
- 1301980 to 1989
- 1431970 to 1979
- 941960 to 1969
- 561950 to 1959
- 2731940 to 1949
- 9871939 or earlier
City-data.com crime index for city in 2020 (higher means more crime):
| City: | 600.2 |
| U.S. average: | 219.5 |
Travel time to work (commute)
![Travel time to work (commute)]()
- 34Less than 5 minutes
- 1165 to 9 minutes
- 21610 to 14 minutes
- 23815 to 19 minutes
- 47020 to 24 minutes
- 24025 to 29 minutes
- 29830 to 34 minutes
- 7535 to 39 minutes
- 3840 to 44 minutes
- 8845 to 59 minutes
- 1060 to 89 minutes
- 4090 or more minutes

Means of transportation to work
![Means of transportation to work]()
- 58.6%1,386Drove a car alone
- 7.3%172Carpooled
- 5.8%137Bus
- 7.7%183Subway or elevated rail
- 3.7%87Light rail, streetcar or trolley
- 0.1%2Taxi
- 0.6%14Motorcycle
- 2.8%67Bicycle
- 6.1%145Walked
- 3.9%92Other means
- 22.2%525Worked at home

Time leaving home to go to work
![Time leaving home to go to work]()
- 3812:00 a.m. to 4:59 a.m.
- 35:00 a.m. to 5:29 a.m.
- 575:30 a.m. to 5:59 a.m.
- 1406:00 a.m. to 6:29 a.m.
- 2286:30 a.m. to 6:59 a.m.
- 2377:00 a.m. to 7:29 a.m.
- 2887:30 a.m. to 7:59 a.m.
- 3688:00 a.m. to 8:29 a.m.
- 918:30 a.m. to 8:59 a.m.
- 2059:00 a.m. to 9:59 a.m.
- 1310:00 a.m. to 10:59 a.m.
- 4411:00 a.m. to 11:59 a.m.
- 7312:00 p.m. to 3:59 p.m.
- 334:00 p.m. to 11:59 p.m.

Occupations of males:
- Percentage of males in management occupations (except farmers):
Here: 12.4% city: 12.1%
- Percentage of males in business and financial operations occupations:
Here: 7.1% city: 9.1%
- Percentage of males in computer and mathematical occupations:
Here: 10.0% city: 8.4%
- Percentage of males in architecture and engineering occupations:
Here: 7.9% city: 4.6%
- Percentage of males in life, physical, and social science occupations:
Here: 1.1% city: 2.0%
- Percentage of males in community and social services occupations:
Here: 1.5% city: 1.8%
- Percentage of males in education, training, and library occupations:
Here: 15.1% city: 5.2%
- Percentage of males in arts, design, entertainment, sports, and media occupations:
Here: 4.7% city: 4.0%
- Percentage of males in healthcare practitioners and technical occupations:
Here: 8.0% city: 3.6%
- Percentage of males in service occupations:
Here: 8.0% city: 12.6%
- Percentage of males in sales and office occupations:
Here: 5.1% city: 15.3%
- Percentage of males in construction, extraction, and maintenance occupations:
Here: 2.7% city: 3.3%
- Percentage of males in production occupations:
Here: 4.2% city: 5.8%
- Percentage of males in transportation occupations:
Here: 4.6% city: 4.1%
- Percentage of males in material moving occupations:
Here: 3.5% city: 3.6%
Occupations of females:
- Percentage of females in management occupations (except farmers):
Here: 12.3% city: 11.4%
- Percentage of females in business and financial operations occupations:
Here: 21.3% city: 9.8%
- Percentage of females in computer and mathematical occupations:
Here: 3.5% city: 2.6%
- Percentage of females in life, physical, and social science occupations:
Here: 1.2% city: 2.3%
- Percentage of females in legal occupations:
Here: 3.8% city: 2.3%
- Percentage of females in education, training, and library occupations:
Here: 16.4% city: 10.6%
- Percentage of females in arts, design, entertainment, sports, and media occupations:
Here: 6.2% city: 5.6%
- Percentage of females in healthcare practitioners and technical occupations:
Here: 11.9% city: 8.3%
- Percentage of females in service occupations:
Here: 7.2% city: 17.8%
- Percentage of females in sales and office occupations:
Here: 12.3% city: 18.7%
- Percentage of females in transportation occupations:
Here: 2.6% city: 0.9%
Percentage of people 16-64 in Armed Forces:
| Ericsson: | 0.0% |
| Minneapolis: | 0.1% |
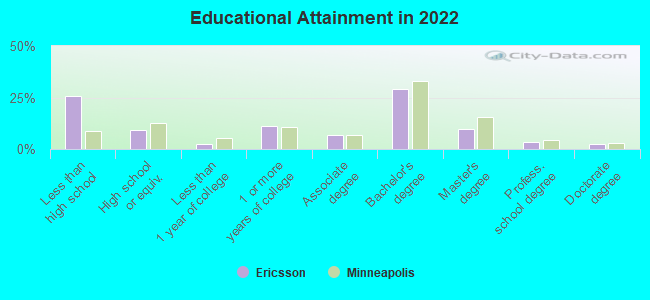
Education in this neighborhood (subdivision or community):
- Percentage of people 3 years and older in K-12 schools:
Ericsson: 24.9% Minneapolis: 14.0%
- Percentage of people 3 years and older in undergraduate colleges:
Ericsson: 6.2% Minneapolis: 8.6%
- Percentage of people 3 years and older in grad. or professional schools:
Ericsson: 4.7% Minneapolis: 2.9%
- Percentage of students K-12 enrolled in private schools:
Ericsson: 56.1% Minneapolis: 14.1%
Percentage of population below poverty level:
| Ericsson: | 3.1% |
| Minneapolis: | 17.2% |
Median year owner moved in (as recorded in 2022):
| Ericsson: | 2007 |
| Minneapolis: | 2012 |
Percentage of married-couple families with both working:
| Ericsson: | 127.1% |
| Minneapolis: | 73.9% |
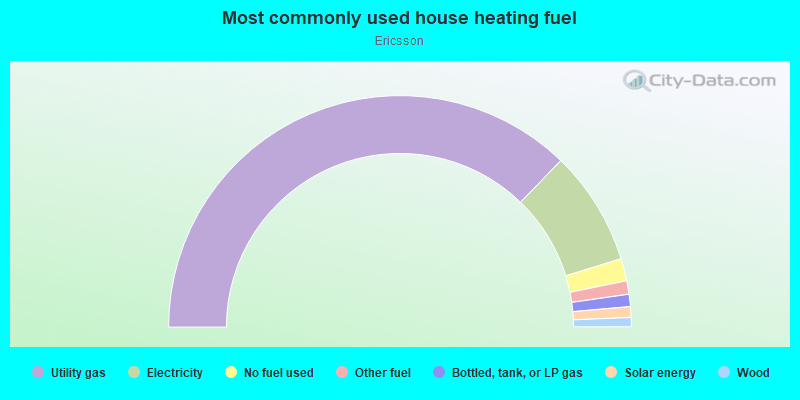
- 74.4%Utility gas
- 16.0%Electricity
- 3.1%No fuel used
- 1.9%Other fuel
- 1.7%Bottled, tank, or LP gas
- 1.5%Solar energy
- 1.3%Wood
Highways in this neighborhood:
State Hwy 55 (Hiawatha Ave)
Length: 0.85 miles
Direction: SE-NW
Address range: 4250 to 4797
Direction: SE-NW
Address range: 4250 to 4797
Roads and streets:
E Minnehaha Pkwy
Length: 1.24 miles
Directions: E-W, N-S
Address range: 2700 to 3997
Directions: E-W, N-S
Address range: 2700 to 3997
E 46th St
Length: 0.93 miles
Direction: E-W
Address range: 2800 to 3697
Direction: E-W
Address range: 2800 to 3697
E 44th St
Length: 0.90 miles
Directions: E-W, SE-NW
Address range: 1846 to 3499
Directions: E-W, SE-NW
Address range: 1846 to 3499
E 45th St
Length: 0.84 miles
Direction: E-W
Address range: 2800 to 3622
Direction: E-W
Address range: 2800 to 3622
29th Ave S
Length: 0.67 miles
Directions: N-S, SW-NE
Address range: 4200 to 4799
Directions: N-S, SW-NE
Address range: 4200 to 4799
Longfellow Ave S
Length: 0.62 miles
Direction: N-S
Address range: 4300 to 4799
Direction: N-S
Address range: 4300 to 4799
Nokomis Ave S
Length: 0.60 miles
Direction: N-S
Address range: 4300 to 4799
Direction: N-S
Address range: 4300 to 4799
34th Ave S
Length: 0.57 miles
Direction: N-S
Address range: 4300 to 4799
Direction: N-S
Address range: 4300 to 4799
30th Ave S
Length: 0.54 miles
Direction: N-S
Address range: 4300 to 4799
Direction: N-S
Address range: 4300 to 4799
E 47th St
Length: 0.53 miles
Directions: E-W, SE-NW
Address range: 2700 to 3750
Directions: E-W, SE-NW
Address range: 2700 to 3750
31st Ave S
Length: 0.53 miles
Directions: N-S, SE-NW
Address range: 4300 to 4799
Directions: N-S, SE-NW
Address range: 4300 to 4799
E 43rd St
Length: 0.53 miles
Direction: E-W
Address range: 2900 to 3399
Direction: E-W
Address range: 2900 to 3399
33rd Ave S
Length: 0.52 miles
Directions: N-S, SW-NE
Address range: 4300 to 4799
Directions: N-S, SW-NE
Address range: 4300 to 4799
32nd Ave S
Length: 0.52 miles
Directions: N-S, SW-NE
Address range: 4300 to 4799
Directions: N-S, SW-NE
Address range: 4300 to 4799
Co Rd 54 (28th Ave)
Length: 0.48 miles
Direction: N-S
Address range: 4400 to 4799
Direction: N-S
Address range: 4400 to 4799
35th Ave S
Length: 0.43 miles
Direction: N-S
Address range: 4400 to 4799
Direction: N-S
Address range: 4400 to 4799
36th Ave S
Length: 0.30 miles
Direction: N-S
Address range: 4500 to 4799
Direction: N-S
Address range: 4500 to 4799
Crosby Pl
Length: 0.26 miles
Direction: E-W
Address range: 3400 to 3699
Direction: E-W
Address range: 3400 to 3699
38th Ave S
Length: 0.12 miles
Directions: N-S, SE-NW
Address range: 4700 to 4799
Directions: N-S, SE-NW
Address range: 4700 to 4799
27th Ave S
Length: 0.11 miles
Direction: N-S
Address range: 4700 to 4799
Direction: N-S
Address range: 4700 to 4799
37th Ave S
Length: 0.10 miles
Direction: N-S
Address range: 4700 to 4799
Direction: N-S
Address range: 4700 to 4799
Other features:
Minnehaha Crk
Length: 1.47 miles
Directions: E-W, N-S, SE-NW, SW-NE
Directions: E-W, N-S, SE-NW, SW-NE