El Camino neighborhood in South San Francisco, California (CA), 94080 detailed profile
Settings
X


Business Search - 14 Million verified businesses
Area: 0.465 square miles
Population: 1,614
Population density:
| El Camino: | 3,473 people per square mile |
| South San Francisco: | 7,272 people per square mile |

- 71943.0%Asian
- 41624.9%Hispanic or Latino
- 39323.5%White
- 663.9%Two or more races
- 432.6%Some other race
- 201.2%Black
- 100.6%American Indian
- 60.4%Native Hawaiian and Other
Pacific Islander

Median household income in 2022:
| El Camino: | $148,116 |
| South San Francisco: | $127,062 |
Distribution of median household income
![Distribution of median household income]()
- 39Less than $10,000
- 13$10,000 to $19,999
- 61$20,000 to $29,999
- 25$30,000 to $39,999
- 44$40,000 to $49,999
- 18$50,000 to $59,999
- 24$60,000 to $74,999
- 48$75,000 to $99,999
- 81$100,000 to $124,999
- 50$125,000 to $149,999
- 109$150,000 to $199,999
- 152$200,000 or more

Distribution of owner-occupied house/condo value
![Distribution of owner-occupied house/condo value]()
- 67Less than $50,000
- 30$50,000 to $99,999
- 5$100,000 to $149,999
- 9$150,000 to $199,999
- 2$200,000 to $249,999
- 7$250,000 to $299,999
- 11$300,000 to $399,999
- 7$400,000 to $499,999
- 23$500,000 to $749,999
- 61$750,000 to $999,999
- 376$1,000,000 or more

Distribution of rent paid by renters
![Distribution of rent paid by renters]()
- 23$100 to $199
- 2$200 to $299
- 1$300 to $399
- 18$400 to $499
- 5$500 to $599
- 1$600 to $699
- 5$700 to $799
- 9$800 to $899
- 4$900 to $999
- 1$1,000 to $1,249
- 34$1,250 to $1,499
- 16$1,500 to $1,999
- 147$2,000 or more

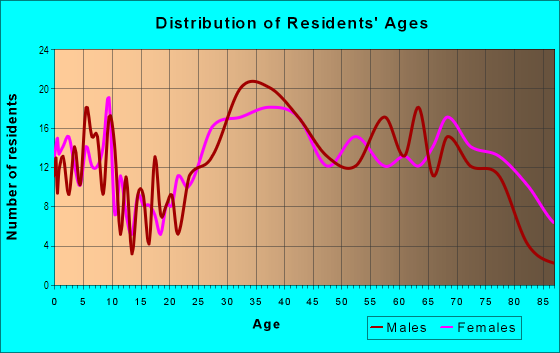
| Males: | 824 |
| Females: | 789 |
Males:
| This neighborhood: | 39.4 years |
| Whole city: | 41.5 years |
| This neighborhood: | 40.1 years |
| Whole city: | 43.2 years |
Average household size:
| El Camino: | 2.9 people |
| South San Francisco: | 2.9 people |
Percentage of family households:
| El Camino: | 51.4% |
| South San Francisco: | 47.2% |
| Here: | 57.1% |
| South San Francisco: | 53.8% |
Percentage of married-couple families with children (among all households):
| El Camino: | 29.0% |
| South San Francisco: | 27.1% |
Percentage of single-mother households (among all households):
| El Camino: | 3.0% |
| South San Francisco: | 4.2% |
Percentage of never married males 15 years old and over:
Percentage of never married females 15 years old and over:
| El Camino: | 22.0% |
| South San Francisco: | 19.8% |
Percentage of never married females 15 years old and over:
| El Camino: | 13.0% |
| city: | 16.1% |
Percentage of people that speak English not well or not at all:
| El Camino: | 4.7% |
| South San Francisco: | 7.5% |
Percentage of people born in this state:
Percentage of people born in another U.S. state:
Percentage of native residents but born outside the U.S.:
Percentage of foreign born residents:
| Here: | 57.3% |
| South San Francisco: | 50.4% |
Percentage of people born in another U.S. state:
| El Camino: | 7.4% |
| South San Francisco: | 8.6% |
Percentage of native residents but born outside the U.S.:
| Here: | 1.9% |
| city: | 2.1% |
Percentage of foreign born residents:
| Here: | 33.4% |
| South San Francisco: | 38.9% |

Owner-occupied
Renter-occupied


- Rooms in owner-occupied houses and condos in El Camino
- 51 room
- 132 rooms
- 83 rooms
- 684 rooms
- 1655 rooms
- 1446 rooms
- 537 rooms
- 358 rooms
- 309+ rooms

- Rooms in renter-occupied apartments in El Camino
- 121 room
- 52 rooms
- 253 rooms
- 274 rooms
- 455 rooms
- 186 rooms
- 287 rooms
- 228 rooms
- 109+ rooms
Owner-occupied
Renter-occupied

- Bedrooms in owner-occupied houses and condos in El Camino
- 5no bedroom
- 151 bedroom
- 562 bedrooms
- 2853 bedrooms
- 714 bedrooms
- 365+ bedrooms

- Bedrooms in renter-occupied apartments in El Camino
- 19no bedroom
- 241 bedroom
- 402 bedrooms
- 543 bedrooms
- 184 bedrooms
- 105+ bedrooms
Average number of cars or other vehicles available in houses/condos:
Average number of cars or other vehicles available in apartments:
| This neighborhood: | 2.3 |
| South San Francisco: | 2.3 |
Average number of cars or other vehicles available in apartments:
| Here: | 1.9 |
| city: | 1.6 |
Percentage of units with a mortgage:
| El Camino: | 73.7% |
| South San Francisco: | 66.6% |
Average estimated value of detached houses in 2022 (88.3% of all units):
| El Camino: | $1,069,092 |
| California: | $988,808 |

- Year house built in El Camino
- 02020 or later
- 152010 to 2019
- 202000 to 2009
- 351990 to 1999
- 511980 to 1989
- 421970 to 1979
- 531960 to 1969
- 2641950 to 1959
- 1531940 to 1949
- 101939 or earlier

City-data.com crime index for city in 2020 (higher means more crime):
| City: | 182.6 |
| U.S. average: | 219.5 |
Travel time to work (commute)
![Travel time to work (commute)]()
- 15Less than 5 minutes
- 405 to 9 minutes
- 17110 to 14 minutes
- 14215 to 19 minutes
- 17120 to 24 minutes
- 6625 to 29 minutes
- 15330 to 34 minutes
- 2535 to 39 minutes
- 4740 to 44 minutes
- 5645 to 59 minutes
- 7860 to 89 minutes
- 2190 or more minutes

Means of transportation to work
![Means of transportation to work]()
- 63.2%553Drove a car alone
- 11.9%104Carpooled
- 2.2%19Bus
- 6.5%57Subway or elevated rail
- 4.7%41Long-distance train or commuter rail
- 6.5%57Light rail, streetcar or trolley
- 4.9%43Taxi
- 0.9%8Motorcycle
- 2.4%21Bicycle
- 2.4%21Walked
- 0.6%5Other means
- 14.7%129Worked at home

Time leaving home to go to work
![Time leaving home to go to work]()
- 6012:00 a.m. to 4:59 a.m.
- 405:00 a.m. to 5:29 a.m.
- 305:30 a.m. to 5:59 a.m.
- 516:00 a.m. to 6:29 a.m.
- 686:30 a.m. to 6:59 a.m.
- 1797:00 a.m. to 7:29 a.m.
- 1187:30 a.m. to 7:59 a.m.
- 1138:00 a.m. to 8:29 a.m.
- 798:30 a.m. to 8:59 a.m.
- 919:00 a.m. to 9:59 a.m.
- 4310:00 a.m. to 10:59 a.m.
- 2611:00 a.m. to 11:59 a.m.
- 7112:00 p.m. to 3:59 p.m.
- 424:00 p.m. to 11:59 p.m.

Occupations of males:
- Percentage of males in management occupations (except farmers):
Here: 15.0% city: 10.8%
- Percentage of males in business and financial operations occupations:
Here: 7.2% city: 7.1%
- Percentage of males in computer and mathematical occupations:
Here: 5.5% city: 6.1%
- Percentage of males in architecture and engineering occupations:
Here: 5.2% city: 4.2%
- Percentage of males in life, physical, and social science occupations:
Here: 1.8% city: 2.4%
- Percentage of males in community and social services occupations:
Here: 2.3% city: 1.2%
- Percentage of males in arts, design, entertainment, sports, and media occupations:
Here: 1.2% city: 1.6%
- Percentage of males in healthcare practitioners and technical occupations:
Here: 8.9% city: 4.2%
- Percentage of males in service occupations:
Here: 8.4% city: 16.0%
- Percentage of males in sales and office occupations:
Here: 13.4% city: 15.7%
- Percentage of males in construction, extraction, and maintenance occupations:
Here: 7.4% city: 6.7%
- Percentage of males in production occupations:
Here: 2.8% city: 4.4%
- Percentage of males in transportation occupations:
Here: 3.9% city: 6.1%
- Percentage of males in material moving occupations:
Here: 7.8% city: 5.5%
Occupations of females:
- Percentage of females in management occupations (except farmers):
Here: 10.1% city: 10.6%
- Percentage of females in business and financial operations occupations:
Here: 8.4% city: 7.8%
- Percentage of females in computer and mathematical occupations:
Here: 1.4% city: 2.2%
- Percentage of females in architecture and engineering occupations:
Here: 1.1% city: 1.1%
- Percentage of females in life, physical, and social science occupations:
Here: 1.5% city: 1.5%
- Percentage of females in legal occupations:
Here: 1.5% city: 2.1%
- Percentage of females in education, training, and library occupations:
Here: 6.0% city: 4.7%
- Percentage of females in healthcare practitioners and technical occupations:
Here: 11.6% city: 10.7%
- Percentage of females in service occupations:
Here: 19.6% city: 20.3%
- Percentage of females in sales and office occupations:
Here: 34.0% city: 32.1%
- Percentage of females in production occupations:
Here: 2.3% city: 2.5%
- Percentage of females in transportation occupations:
Here: 1.1% city: 0.8%
Percentage of people 16-64 in Armed Forces:
| El Camino: | 0.0% |
| South San Francisco: | 0.0% |
Education in this neighborhood (subdivision or community):
- Percentage of people 3 years and older in K-12 schools:
El Camino: 15.9% South San Francisco: 13.0%
- Percentage of people 3 years and older in undergraduate colleges:
El Camino: 7.1% South San Francisco: 6.2%
- Percentage of people 3 years and older in grad. or professional schools:
El Camino: 1.5% South San Francisco: 1.3%
- Percentage of students K-12 enrolled in private schools:
El Camino: 63.3% South San Francisco: 21.0%
Percentage of population below poverty level:
| El Camino: | 5.9% |
| South San Francisco: | 6.8% |
Median year owner moved in (as recorded in 2022):
| El Camino: | 2003 |
| South San Francisco: | 2003 |
Percentage of married-couple families with both working:
| El Camino: | 96.9% |
| South San Francisco: | 76.4% |

- 61.8%Utility gas
- 27.8%Electricity
- 3.8%Bottled, tank, or LP gas
- 2.5%Wood
- 2.2%No fuel used
- 1.0%Fuel oil, kerosene, etc.
- 1.0%Solar energy
Highways in this neighborhood:
el Camino Real (State Hwy 82)
Length: 1.56 miles
Directions: E-W, SE-NW
Address range: 400 to 1698
Directions: E-W, SE-NW
Address range: 400 to 1698
Roads and streets:
Cybidium Cir
Length: 0.57 miles
Directions: E-W, N-S, SE-NW, SW-NE
Directions: E-W, N-S, SE-NW, SW-NE
Huntington Ave
Length: 0.29 miles
Direction: SE-NW
Address range: 1400 to 1499
Direction: SE-NW
Address range: 1400 to 1499
Noor Ave
Length: 0.26 miles
Direction: E-W
Address range: 400 to 498
Direction: E-W
Address range: 400 to 498
Mc Lellan Dr
Length: 0.25 miles
Directions: E-W, N-S, SW-NE
Address range: 600 to 699
Directions: E-W, N-S, SW-NE
Address range: 600 to 699
Freesia Dr
Length: 0.24 miles
Directions: E-W, N-S, SE-NW, SW-NE
Directions: E-W, N-S, SE-NW, SW-NE
S Spruce Ave
Length: 0.24 miles
Directions: E-W, SW-NE
Address range: 400 to 499
Directions: E-W, SW-NE
Address range: 400 to 499
Orchid Dr
Length: 0.17 miles
Directions: E-W, N-S, SE-NW
Address range: 600 to 699
Directions: E-W, N-S, SE-NW
Address range: 600 to 699
Mission Rd
Length: 0.16 miles
Direction: SE-NW
Address range: 1600 to 1727
Direction: SE-NW
Address range: 1600 to 1727
Alta Loma Dr
Length: 0.11 miles
Directions: E-W, SE-NW
Address range: 700 to 790
Directions: E-W, SE-NW
Address range: 700 to 790
Alida Way
Length: 0.10 miles
Directions: E-W, SE-NW
Address range: 311 to 362
Directions: E-W, SE-NW
Address range: 311 to 362
Mc Donell Dr
Length: 0.08 miles
Direction: SE-NW
Address range: 700 to 799
Direction: SE-NW
Address range: 700 to 799
Arroyo Dr
Length: 0.07 miles
Direction: SW-NE
Address range: 1 to 49
Direction: SW-NE
Address range: 1 to 49
Chestnut Ave
Length: 0.07 miles
Direction: SW-NE
Address range: 1 to 49
Direction: SW-NE
Address range: 1 to 49
Hibiscus Dr
Length: 0.05 miles
Directions: N-S, SE-NW
Directions: N-S, SE-NW
W Orange Ave
Length: 0.05 miles
Direction: SW-NE
Address range: 500 to 614
Direction: SW-NE
Address range: 500 to 614
Hazelwood Dr
Length: 0.04 miles
Direction: SW-NE
Address range: 1 to 98
Direction: SW-NE
Address range: 1 to 98
Brentwood Dr
Length: 0.04 miles
Direction: SW-NE
Address range: 1 to 99
Direction: SW-NE
Address range: 1 to 99
Railroad features:
Bay Area Rapid Transit RR
Length: 0.07 miles
Direction: SE-NW
Direction: SE-NW
Other features:
Colma Crk
Length: 0.16 miles
Directions: N-S, SE-NW
Directions: N-S, SE-NW