Eastshore neighborhood in Richmond, California (CA), 94804 detailed profile
Settings
X


Business Search - 14 Million verified businesses
Area: 0.063 square miles
Population: 874
Population density:
| Eastshore: | 13,907 people per square mile |
| Richmond: | 3,812 people per square mile |

- 31535.5%Black
- 22925.8%Hispanic or Latino
- 21524.2%White
- 748.3%Two or more races
- 212.4%Some other race
- 182.0%Asian
- 151.7%Native Hawaiian and Other
Pacific Islander

Median household income in 2022:
| Eastshore: | $53,261 |
| Richmond: | $88,594 |
Distribution of median household income
![Distribution of median household income]()
- 66Less than $10,000
- 18$10,000 to $19,999
- 26$20,000 to $29,999
- 52$30,000 to $39,999
- 25$40,000 to $49,999
- 19$50,000 to $59,999
- 8$60,000 to $74,999
- 23$75,000 to $99,999
- 38$100,000 to $124,999
- 7$125,000 to $149,999
- 15$150,000 to $199,999
- 40$200,000 or more

Distribution of owner-occupied house/condo value
![Distribution of owner-occupied house/condo value]()
- 1Less than $50,000
- 1$50,000 to $99,999
- 4$200,000 to $249,999
- 3$250,000 to $299,999
- 24$300,000 to $399,999
- 14$400,000 to $499,999
- 14$500,000 to $749,999
- 29$750,000 to $999,999
- 6$1,000,000 or more

Distribution of rent paid by renters
![Distribution of rent paid by renters]()
- 3Less than $100
- 19$300 to $399
- 49$400 to $499
- 17$500 to $599
- 15$600 to $699
- 8$700 to $799
- 15$800 to $899
- 41$1,000 to $1,249
- 52$1,250 to $1,499
- 33$1,500 to $1,999
- 54$2,000 or more

Median rent in 2022:
| Eastshore: | $1,275 |
| Richmond: | $1,601 |
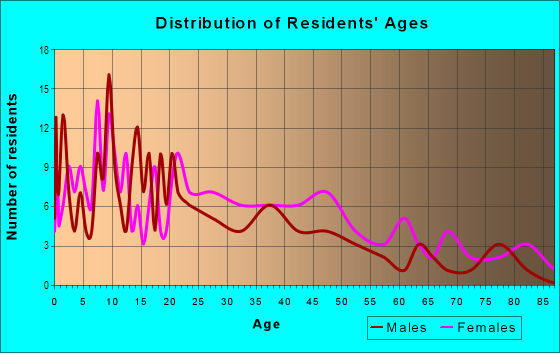
| Males: | 410 |
| Females: | 464 |
Males:
| This neighborhood: | 30.4 years |
| Whole city: | 35.3 years |
| This neighborhood: | 34.7 years |
| Whole city: | 43.0 years |
Average household size:
| Eastshore: | 36.0 people |
| Richmond: | 2.8 people |
Percentage of family households:
| Eastshore: | 60.9% |
| Richmond: | 42.7% |
| Here: | 41.1% |
| Richmond: | 40.5% |
Percentage of married-couple families with children (among all households):
| Eastshore: | 15.1% |
| Richmond: | 21.6% |
Percentage of single-mother households (among all households):
| Eastshore: | 13.2% |
| Richmond: | 9.9% |
Percentage of never married males 15 years old and over:
Percentage of never married females 15 years old and over:
| Eastshore: | 18.4% |
| Richmond: | 25.4% |
Percentage of never married females 15 years old and over:
| Eastshore: | 25.2% |
| city: | 19.6% |
Percentage of people that speak English not well or not at all:
| Eastshore: | 12.6% |
| Richmond: | 12.7% |
Percentage of people born in this state:
Percentage of people born in another U.S. state:
Percentage of native residents but born outside the U.S.:
Percentage of foreign born residents:
| Here: | 55.0% |
| Richmond: | 47.4% |
Percentage of people born in another U.S. state:
| Eastshore: | 13.8% |
| Richmond: | 14.0% |
Percentage of native residents but born outside the U.S.:
| Here: | 0.9% |
| city: | 2.3% |
Percentage of foreign born residents:
| Here: | 30.3% |
| Richmond: | 36.3% |

Owner-occupied
Renter-occupied


- Rooms in owner-occupied houses and condos in Eastshore
- 171 room
- 02 rooms
- 43 rooms
- 234 rooms
- 85 rooms
- 296 rooms
- 277 rooms
- 78 rooms
- 59+ rooms

- Rooms in renter-occupied apartments in Eastshore
- 121 room
- 02 rooms
- 193 rooms
- 884 rooms
- 715 rooms
- 296 rooms
- 07 rooms
- 68 rooms
- 59+ rooms
Owner-occupied
Renter-occupied

- Bedrooms in owner-occupied houses and condos in Eastshore
- 17no bedroom
- 41 bedroom
- 42 bedrooms
- 303 bedrooms
- 204 bedrooms
- 05+ bedrooms

- Bedrooms in renter-occupied apartments in Eastshore
- 12no bedroom
- 211 bedroom
- 1182 bedrooms
- 603 bedrooms
- 154 bedrooms
- 55+ bedrooms
Average number of cars or other vehicles available in houses/condos:
Average number of cars or other vehicles available in apartments:
| This neighborhood: | 1.4 |
| Richmond: | 2.2 |
Average number of cars or other vehicles available in apartments:
| Here: | 1.6 |
| city: | 1.7 |
Percentage of units with a mortgage:
| Eastshore: | 77.6% |
| Richmond: | 67.4% |
Average estimated value of detached houses in 2022 (35.3% of all units):
| Eastshore: | $497,746 |
| Richmond: | $610,033 |

- Year house built in Eastshore
- 02020 or later
- 92010 to 2019
- 02000 to 2009
- 241990 to 1999
- 61980 to 1989
- 1051970 to 1979
- 871960 to 1969
- 681950 to 1959
- 81940 to 1949
- 131939 or earlier

City-data.com crime index for city in 2020 (higher means more crime):
| City: | 461.7 |
| U.S. average: | 219.5 |
Travel time to work (commute)
![Travel time to work (commute)]()
- 5Less than 5 minutes
- 435 to 9 minutes
- 4710 to 14 minutes
- 5015 to 19 minutes
- 9020 to 24 minutes
- 525 to 29 minutes
- 5230 to 34 minutes
- 935 to 39 minutes
- 4340 to 44 minutes
- 6545 to 59 minutes
- 8060 to 89 minutes
- 2890 or more minutes

Means of transportation to work
![Means of transportation to work]()
- 69.9%226Drove a car alone
- 20.4%66Carpooled
- 8.0%26Bus
- 8.7%28Subway or elevated rail
- 1.9%6Walked
- 7.1%23Other means
- 0.6%2Worked at home

Time leaving home to go to work
![Time leaving home to go to work]()
- 3512:00 a.m. to 4:59 a.m.
- 75:00 a.m. to 5:29 a.m.
- 345:30 a.m. to 5:59 a.m.
- 526:00 a.m. to 6:29 a.m.
- 486:30 a.m. to 6:59 a.m.
- 587:00 a.m. to 7:29 a.m.
- 677:30 a.m. to 7:59 a.m.
- 518:00 a.m. to 8:29 a.m.
- 308:30 a.m. to 8:59 a.m.
- 109:00 a.m. to 9:59 a.m.
- 610:00 a.m. to 10:59 a.m.
- 1511:00 a.m. to 11:59 a.m.
- 6912:00 p.m. to 3:59 p.m.
- 324:00 p.m. to 11:59 p.m.

Occupations of males:
- Percentage of males in management occupations (except farmers):
Here: 13.0% city: 9.4%
- Percentage of males in business and financial operations occupations:
Here: 5.0% city: 4.6%
- Percentage of males in computer and mathematical occupations:
Here: 8.5% city: 3.3%
- Percentage of males in architecture and engineering occupations:
Here: 2.0% city: 2.9%
- Percentage of males in education, training, and library occupations:
Here: 4.7% city: 3.6%
- Percentage of males in arts, design, entertainment, sports, and media occupations:
Here: 3.0% city: 2.2%
- Percentage of males in service occupations:
Here: 35.4% city: 18.4%
- Percentage of males in sales and office occupations:
Here: 14.3% city: 13.4%
- Percentage of males in construction, extraction, and maintenance occupations:
Here: 8.0% city: 14.7%
- Percentage of males in production occupations:
Here: 9.2% city: 4.8%
- Percentage of males in transportation occupations:
Here: 15.8% city: 8.9%
- Percentage of males in material moving occupations:
Here: 8.5% city: 5.0%
Occupations of females:
- Percentage of females in management occupations (except farmers):
Here: 18.3% city: 10.0%
- Percentage of females in business and financial operations occupations:
Here: 3.7% city: 4.9%
- Percentage of females in community and social services occupations:
Here: 14.1% city: 3.3%
- Percentage of females in legal occupations:
Here: 2.1% city: 1.1%
- Percentage of females in education, training, and library occupations:
Here: 4.1% city: 8.3%
- Percentage of females in healthcare practitioners and technical occupations:
Here: 6.7% city: 4.9%
- Percentage of females in service occupations:
Here: 45.5% city: 28.3%
- Percentage of females in sales and office occupations:
Here: 5.9% city: 25.4%
- Percentage of females in transportation occupations:
Here: 12.1% city: 1.9%
- Percentage of females in material moving occupations:
Here: 13.9% city: 3.0%
Education in this neighborhood (subdivision or community):
- Percentage of people 3 years and older in K-12 schools:
Eastshore: 23.5% Richmond: 17.8%
- Percentage of people 3 years and older in undergraduate colleges:
Eastshore: 3.4% Richmond: 4.5%
- Percentage of people 3 years and older in grad. or professional schools:
Eastshore: 1.1% Richmond: 0.8%
- Percentage of students K-12 enrolled in private schools:
Eastshore: 16.8% Richmond: 7.3%
Percentage of population below poverty level:
| Eastshore: | 11.1% |
| Richmond: | 16.2% |
Median year owner moved in (as recorded in 2022):
Median year renter moved in (as recorded in 2022):
| Eastshore: | 1989 |
| Richmond: | 2006 |
Median year renter moved in (as recorded in 2022):
| Eastshore: | 2013 |
| Richmond: | 2016 |
Percentage of married-couple families with both working:
| Eastshore: | 79.3% |
| Richmond: | 68.0% |

- 56.2%Utility gas
- 12.7%Electricity
- 10.5%Bottled, tank, or LP gas
- 8.4%No fuel used
- 6.4%Other fuel
- 5.7%Solar energy
Roads and streets:
Carlson Blvd
Length: 0.30 miles
Direction: SE-NW
Address range: 862 to 998
Direction: SE-NW
Address range: 862 to 998
Potrero Ave
Length: 0.29 miles
Direction: E-W
Address range: 3951 to 4499
Direction: E-W
Address range: 3951 to 4499
S 45th St
Length: 0.22 miles
Directions: N-S, SW-NE
Address range: 800 to 999
Directions: N-S, SW-NE
Address range: 800 to 999
S 43rd St
Length: 0.15 miles
Directions: N-S, SW-NE
Address range: 800 to 999
Directions: N-S, SW-NE
Address range: 800 to 999
S 46th St
Length: 0.13 miles
Directions: N-S, SW-NE
Address range: 800 to 999
Directions: N-S, SW-NE
Address range: 800 to 999
Sycamore Ave
Length: 0.10 miles
Direction: SE-NW
Address range: 4300 to 4499
Direction: SE-NW
Address range: 4300 to 4499
Rosewood Ave
Length: 0.10 miles
Direction: SE-NW
Address range: 4100 to 4299
Direction: SE-NW
Address range: 4100 to 4299
S 41st St
Length: 0.08 miles
Direction: SW-NE
Address range: 800 to 999
Direction: SW-NE
Address range: 800 to 999
S 47th St
Length: 0.05 miles
Direction: SW-NE
Address range: 962 to 1023
Direction: SW-NE
Address range: 962 to 1023
Olive Ct
Length: 0.05 miles
Directions: E-W, SE-NW
Address range: 4600 to 4699
Directions: E-W, SE-NW
Address range: 4600 to 4699
Cypress Ave
Length: 0.05 miles
Direction: SE-NW
Address range: 4500 to 4599
Direction: SE-NW
Address range: 4500 to 4599
S 40th St
Length: 0.03 miles
Direction: N-S
Address range: 700 to 799
Direction: N-S
Address range: 700 to 799