East Campus neighborhood in Boulder, Colorado (CO), 80303 detailed profile
Settings
X


Business Search - 14 Million verified businesses
Area: 0.297 square miles
Population: 504
Population density:
| East Campus: | 1,698 people per square mile |
| Boulder: | 4,328 people per square mile |

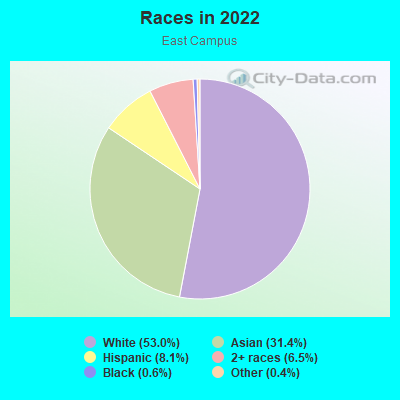
- 26853.0%White
- 15931.4%Asian
- 418.1%Hispanic or Latino
- 336.5%Two or more races
- 30.6%Black
- 20.4%Some other race
Median household income in 2022:
| East Campus: | $50,761 |
| Boulder: | $81,608 |
Distribution of median household income
![Distribution of median household income]()
- 4Less than $10,000
- 43$10,000 to $19,999
- 17$20,000 to $29,999
- 37$30,000 to $39,999
- 30$40,000 to $49,999
- 28$50,000 to $59,999
- 6$60,000 to $74,999
- 33$75,000 to $99,999
- 20$100,000 to $124,999
- 10$150,000 to $199,999
- 15$200,000 or more

Distribution of owner-occupied house/condo value
![Distribution of owner-occupied house/condo value]()
- 10$300,000 to $399,999
- 3$400,000 to $499,999
- 17$500,000 to $749,999
- 6$750,000 to $999,999

Distribution of rent paid by renters
![Distribution of rent paid by renters]()
- 2$600 to $699
- 6$1,000 to $1,249
- 87$1,250 to $1,499
- 38$1,500 to $1,999
- 45$2,000 or more

Median rent in 2022:
| East Campus: | $1,458 |
| Boulder: | $1,700 |
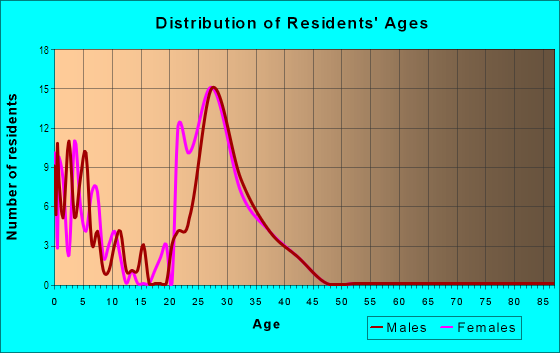
| Males: | 281 |
| Females: | 222 |
Males:
| This neighborhood: | 24.5 years |
| Whole city: | 28.3 years |
| This neighborhood: | 20.8 years |
| Whole city: | 29.2 years |
Average household size:
| East Campus: | 2.5 people |
| Boulder: | 2.1 people |
Percentage of family households:
| East Campus: | 40.0% |
| Boulder: | 26.9% |
| Here: | 34.7% |
| Boulder: | 30.4% |
Percentage of married-couple families with children (among all households):
| East Campus: | 29.3% |
| Boulder: | 32.8% |
Percentage of single-mother households (among all households):
| East Campus: | 0.8% |
| Boulder: | 6.3% |
Percentage of never married males 15 years old and over:
Percentage of never married females 15 years old and over:
| East Campus: | 42.5% |
| Boulder: | 32.7% |
Percentage of never married females 15 years old and over:
| East Campus: | 23.9% |
| city: | 28.3% |
Percentage of people that speak English not well or not at all:
| East Campus: | 0.0% |
| Boulder: | 1.0% |
Percentage of people born in this state:
Percentage of people born in another U.S. state:
Percentage of native residents but born outside the U.S.:
Percentage of foreign born residents:
| Here: | 32.4% |
| Boulder: | 28.3% |
Percentage of people born in another U.S. state:
| East Campus: | 45.2% |
| Boulder: | 60.5% |
Percentage of native residents but born outside the U.S.:
| Here: | 4.2% |
| city: | 2.1% |
Percentage of foreign born residents:
| Here: | 18.2% |
| Boulder: | 9.1% |
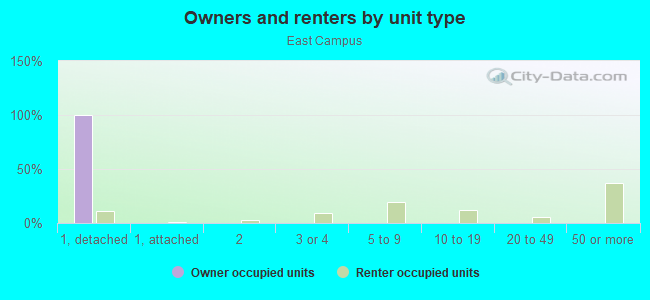
Owner-occupied
Renter-occupied

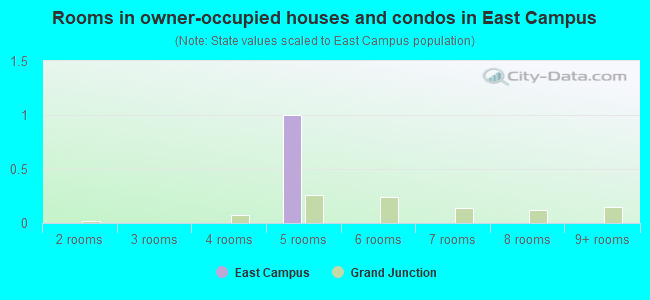
- Rooms in owner-occupied houses and condos in East Campus
- 01 room
- 02 rooms
- 53 rooms
- 54 rooms
- 115 rooms
- 06 rooms
- 27 rooms
- 08 rooms
- 09+ rooms
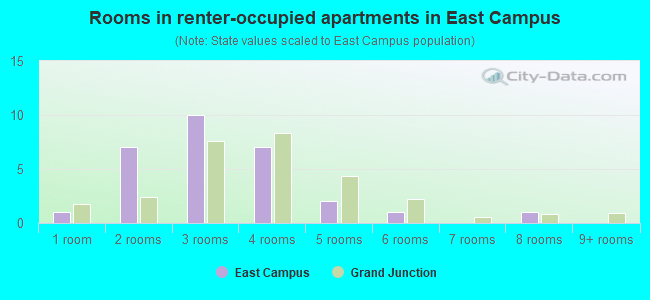
- Rooms in renter-occupied apartments in East Campus
- 261 room
- 212 rooms
- 453 rooms
- 214 rooms
- 405 rooms
- 256 rooms
- 67 rooms
- 148 rooms
- 49+ rooms
Owner-occupied
Renter-occupied
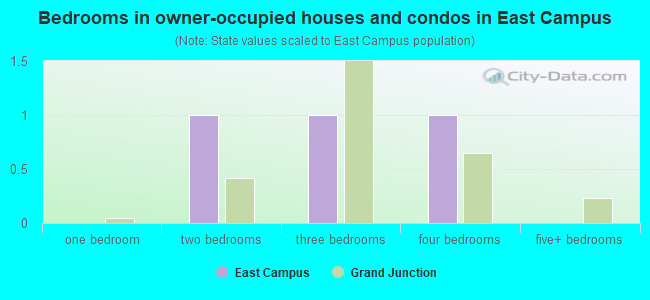
- Bedrooms in owner-occupied houses and condos in East Campus
- 0no bedroom
- 51 bedroom
- 192 bedrooms
- 23 bedrooms
- 04 bedrooms
- 05+ bedrooms
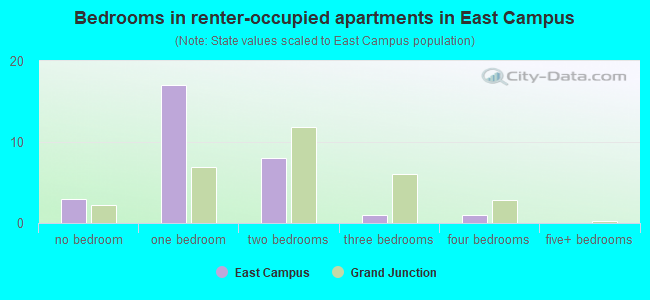
- Bedrooms in renter-occupied apartments in East Campus
- 26no bedroom
- 421 bedroom
- 602 bedrooms
- 273 bedrooms
- 94 bedrooms
- 165+ bedrooms
Average number of cars or other vehicles available in houses/condos:
Average number of cars or other vehicles available in apartments:
| This neighborhood: | |
| Boulder: |
Average number of cars or other vehicles available in apartments:
| Here: | 1.5 |
| city: | 1.6 |
Percentage of units with a mortgage:
| East Campus: | 35.5% |
| Boulder: | 60.5% |
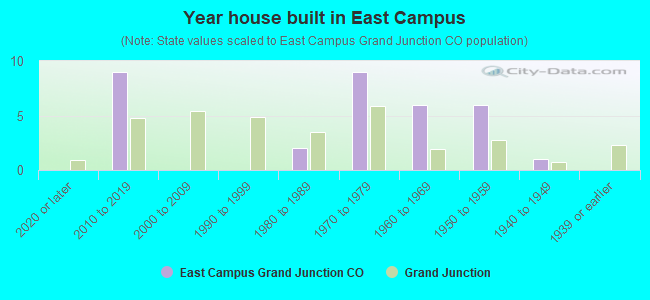
- Year house built in East Campus
- 02020 or later
- 52010 to 2019
- 132000 to 2009
- 211990 to 1999
- 31980 to 1989
- 551970 to 1979
- 651960 to 1969
- 171950 to 1959
- 01940 to 1949
- 31939 or earlier
City-data.com crime index for city in 2020 (higher means more crime):
| City: | 275.1 |
| U.S. average: | 219.5 |
Travel time to work (commute)
![Travel time to work (commute)]()
- 415 to 9 minutes
- 10910 to 14 minutes
- 6315 to 19 minutes
- 4020 to 24 minutes
- 2030 to 34 minutes
- 735 to 39 minutes
- 340 to 44 minutes
- 445 to 59 minutes
- 760 to 89 minutes

Means of transportation to work
![Means of transportation to work]()
- 16.6%45Drove a car alone
- 5.9%16Carpooled
- 12.2%33Bus
- 13.3%36Bicycle
- 36.1%98Walked
- 1.8%5Other means
- 12.9%35Worked at home

Time leaving home to go to work
![Time leaving home to go to work]()
- 312:00 a.m. to 4:59 a.m.
- 95:30 a.m. to 5:59 a.m.
- 116:30 a.m. to 6:59 a.m.
- 217:00 a.m. to 7:29 a.m.
- 377:30 a.m. to 7:59 a.m.
- 388:00 a.m. to 8:29 a.m.
- 218:30 a.m. to 8:59 a.m.
- 839:00 a.m. to 9:59 a.m.
- 2110:00 a.m. to 10:59 a.m.
- 2711:00 a.m. to 11:59 a.m.
- 912:00 p.m. to 3:59 p.m.
- 184:00 p.m. to 11:59 p.m.

Occupations of males:
- Percentage of males in management occupations (except farmers):
Here: 7.9% city: 12.9%
- Percentage of males in business and financial operations occupations:
Here: 7.9% city: 7.6%
- Percentage of males in computer and mathematical occupations:
Here: 13.6% city: 10.0%
- Percentage of males in architecture and engineering occupations:
Here: 10.0% city: 6.1%
- Percentage of males in life, physical, and social science occupations:
Here: 33.6% city: 6.1%
- Percentage of males in legal occupations:
Here: 1.4% city: 2.1%
- Percentage of males in education, training, and library occupations:
Here: 24.0% city: 8.1%
- Percentage of males in arts, design, entertainment, sports, and media occupations:
Here: 2.2% city: 3.3%
- Percentage of males in healthcare practitioners and technical occupations:
Here: 3.2% city: 1.9%
- Percentage of males in service occupations:
Here: 13.8% city: 14.4%
- Percentage of males in sales and office occupations:
Here: 18.4% city: 14.5%
- Percentage of males in construction, extraction, and maintenance occupations:
Here: 3.7% city: 2.8%
- Percentage of males in production occupations:
Here: 2.3% city: 2.3%
Occupations of females:
- Percentage of females in management occupations (except farmers):
Here: 2.5% city: 8.8%
- Percentage of females in business and financial operations occupations:
Here: 15.5% city: 6.4%
- Percentage of females in computer and mathematical occupations:
Here: 7.5% city: 4.6%
- Percentage of females in architecture and engineering occupations:
Here: 8.5% city: 1.9%
- Percentage of females in life, physical, and social science occupations:
Here: 25.0% city: 4.7%
- Percentage of females in legal occupations:
Here: 5.8% city: 1.4%
- Percentage of females in education, training, and library occupations:
Here: 38.5% city: 13.1%
- Percentage of females in healthcare practitioners and technical occupations:
Here: 1.9% city: 7.2%
- Percentage of females in sales and office occupations:
Here: 27.9% city: 19.4%
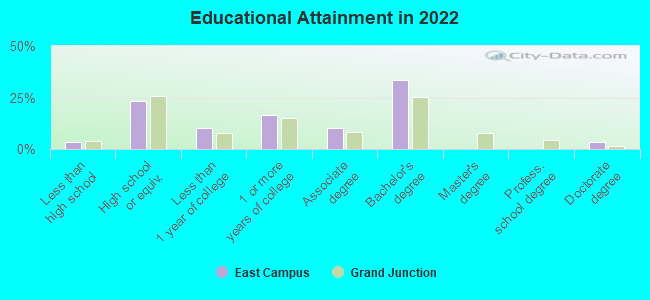
Education in this neighborhood (subdivision or community):
- Percentage of people 3 years and older in K-12 schools:
East Campus: 8.4% Boulder: 8.8%
- Percentage of people 3 years and older in undergraduate colleges:
East Campus: 30.9% Boulder: 28.2%
- Percentage of people 3 years and older in grad. or professional schools:
East Campus: 19.5% Boulder: 6.1%
- Percentage of students K-12 enrolled in private schools:
East Campus: 0.0% Boulder: 8.5%
Percentage of population below poverty level:
| East Campus: | 48.7% |
| Boulder: | 24.1% |
Median year renter moved in (as recorded in 2022):
| East Campus: | 2020 |
| Boulder: | 2022 |
Percentage of married-couple families with both working:
| East Campus: | 20.0% |
| Boulder: | 76.2% |
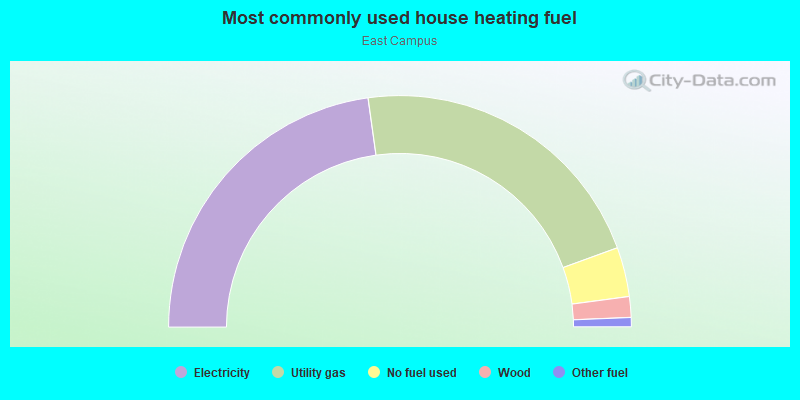
- 46.8%Utility gas
- 27.6%Electricity
- 21.6%No fuel used
- 2.4%Bottled, tank, or LP gas
- 1.6%Other fuel
Roads and streets:
Discovery Dr
Length: 1.03 miles
Directions: E-W, SE-NW, SW-NE
Directions: E-W, SE-NW, SW-NE
Innovation Dr
Length: 0.30 miles
Directions: E-W, N-S, SE-NW, SW-NE
Address range: 1200 to 1299
Directions: E-W, N-S, SE-NW, SW-NE
Address range: 1200 to 1299
33rd St
Length: 0.24 miles
Directions: N-S, SE-NW
Directions: N-S, SE-NW
Colorado Ct
Length: 0.07 miles
Direction: E-W
Direction: E-W
Other features:
Boulder Crk
Length: 0.47 miles
Directions: E-W, SW-NE
Directions: E-W, SW-NE
Other features:
Wellman Canal Ditch
Length: 0.11 miles
Direction: E-W
Direction: E-W