Downtown Sunnyvale (Downtown) neighborhood in Sunnyvale, California (CA), 94086 detailed profile
Settings
X


Business Search - 14 Million verified businesses
Area: 0.352 square miles
Population: 3,883
Population density:
| Downtown Sunnyvale (Downtown): | 11,020 people per square mile |
| Sunnyvale: | 6,978 people per square mile |

- 1,52837.4%White
- 1,25230.7%Asian
- 65216.0%Hispanic or Latino
- 3689.0%Two or more races
- 2225.4%Some other race
- 501.2%Black
- 100.2%Native Hawaiian and Other
Pacific Islander - 10.02%American Indian

Median household income in 2022:
| Downtown Sunnyvale (Downtown): | $163,644 |
| Sunnyvale: | $169,781 |
Distribution of median household income
![Distribution of median household income]()
- 34Less than $10,000
- 339$10,000 to $19,999
- 56$20,000 to $29,999
- 180$30,000 to $39,999
- 90$40,000 to $49,999
- 91$50,000 to $59,999
- 47$60,000 to $74,999
- 118$75,000 to $99,999
- 219$100,000 to $124,999
- 48$125,000 to $149,999
- 323$150,000 to $199,999
- 594$200,000 or more

Distribution of owner-occupied house/condo value
![Distribution of owner-occupied house/condo value]()
- 18Less than $50,000
- 39$100,000 to $149,999
- 27$200,000 to $249,999
- 31$300,000 to $399,999
- 24$500,000 to $749,999
- 29$750,000 to $999,999
- 396$1,000,000 or more

Distribution of rent paid by renters
![Distribution of rent paid by renters]()
- 10$200 to $299
- 71$300 to $399
- 27$500 to $599
- 387$600 to $699
- 123$700 to $799
- 78$800 to $899
- 49$900 to $999
- 12$1,000 to $1,249
- 11$1,250 to $1,499
- 146$1,500 to $1,999
- 940$2,000 or more

Median rent in 2022:
| Downtown Sunnyvale (Downtown): | $2,765 |
| Sunnyvale: | $2,001 |
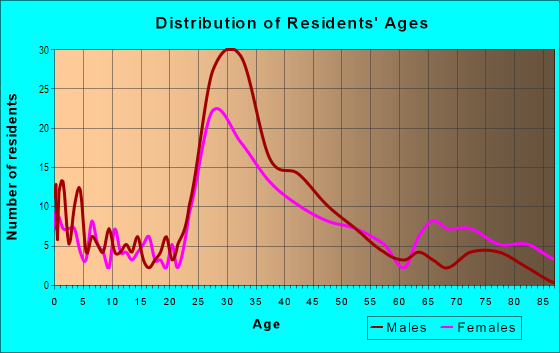
| Males: | 2,058 |
| Females: | 1,824 |
Males:
| This neighborhood: | 40.8 years |
| Whole city: | 34.2 years |
| This neighborhood: | 43.9 years |
| Whole city: | 37.1 years |
Average household size:
| Downtown Sunnyvale (Downtown): | 2.5 people |
| Sunnyvale: | 2.6 people |
Percentage of family households:
| Downtown Sunnyvale (Downtown): | 44.5% |
| Sunnyvale: | 47.1% |
| Here: | 51.0% |
| Sunnyvale: | 50.8% |
Percentage of married-couple families with children (among all households):
| Downtown Sunnyvale (Downtown): | 36.1% |
| Sunnyvale: | 33.2% |
Percentage of single-mother households (among all households):
| Downtown Sunnyvale (Downtown): | 2.6% |
| Sunnyvale: | 4.2% |
Percentage of never married males 15 years old and over:
Percentage of never married females 15 years old and over:
| Downtown Sunnyvale (Downtown): | 18.5% |
| Sunnyvale: | 23.3% |
Percentage of never married females 15 years old and over:
| Downtown Sunnyvale (Downtown): | 14.7% |
| city: | 13.4% |
Percentage of people that speak English not well or not at all:
| Downtown Sunnyvale (Downtown): | 5.6% |
| Sunnyvale: | 8.1% |
Percentage of people born in this state:
Percentage of people born in another U.S. state:
Percentage of native residents but born outside the U.S.:
Percentage of foreign born residents:
| Here: | 43.0% |
| Sunnyvale: | 37.8% |
Percentage of people born in another U.S. state:
| Downtown Sunnyvale (Downtown): | 19.8% |
| Sunnyvale: | 12.0% |
Percentage of native residents but born outside the U.S.:
| Here: | 0.3% |
| city: | 1.7% |
Percentage of foreign born residents:
| Here: | 36.9% |
| Sunnyvale: | 48.5% |

Owner-occupied
Renter-occupied


- Rooms in owner-occupied houses and condos in Downtown Sunnyvale <
> - 01 room
- 92 rooms
- 733 rooms
- 1564 rooms
- 265 rooms
- 1276 rooms
- 647 rooms
- 1268 rooms
- 389+ rooms

- Rooms in renter-occupied apartments in Downtown Sunnyvale <
> - 2871 room
- 1472 rooms
- 3073 rooms
- 3654 rooms
- 785 rooms
- 1116 rooms
- 847 rooms
- 648 rooms
- 289+ rooms
Owner-occupied
Renter-occupied

- Bedrooms in owner-occupied houses and condos in Downtown Sunnyvale <
> - 0no bedroom
- 191 bedroom
- 702 bedrooms
- 2323 bedrooms
- 1144 bedrooms
- 1165+ bedrooms

- Bedrooms in renter-occupied apartments in Downtown Sunnyvale <
> - 287no bedroom
- 1481 bedroom
- 5442 bedrooms
- 2053 bedrooms
- 584 bedrooms
- 05+ bedrooms
Average number of cars or other vehicles available in houses/condos:
Average number of cars or other vehicles available in apartments:
| This neighborhood: | 2.0 |
| Sunnyvale: | 2.0 |
Average number of cars or other vehicles available in apartments:
| Here: | 1.6 |
| city: | 1.5 |
Percentage of units with a mortgage:
| Downtown Sunnyvale (Downtown): | 71.7% |
| Sunnyvale: | 57.7% |
Average estimated value of detached houses in 2022 (36.4% of all units):
| Downtown Sunnyvale (Downtown): | $1,777,183 |
| Sunnyvale: | $2,056,322 |

- Year house built in Downtown Sunnyvale <
> - 102020 or later
- 4732010 to 2019
- 5202000 to 2009
- 2221990 to 1999
- 2531980 to 1989
- 961970 to 1979
- 1151960 to 1969
- 2851950 to 1959
- 1431940 to 1949
- 1361939 or earlier

City-data.com crime index for city in 2020 (higher means more crime):
| City: | 151.0 |
| U.S. average: | 219.5 |
Travel time to work (commute)
![Travel time to work (commute)]()
- 13Less than 5 minutes
- 815 to 9 minutes
- 22410 to 14 minutes
- 24415 to 19 minutes
- 36520 to 24 minutes
- 11125 to 29 minutes
- 24930 to 34 minutes
- 2935 to 39 minutes
- 7240 to 44 minutes
- 10545 to 59 minutes
- 7360 to 89 minutes
- 1790 or more minutes

Means of transportation to work
![Means of transportation to work]()
- 50.0%1,123Drove a car alone
- 10.6%238Carpooled
- 7.6%170Bus
- 0.5%12Subway or elevated rail
- 3.2%71Long-distance train or commuter rail
- 0.4%9Taxi
- 3.5%78Motorcycle
- 1.4%31Bicycle
- 1.6%37Walked
- 7.4%167Other means
- 27.2%612Worked at home

Time leaving home to go to work
![Time leaving home to go to work]()
- 2112:00 a.m. to 4:59 a.m.
- 895:00 a.m. to 5:29 a.m.
- 275:30 a.m. to 5:59 a.m.
- 986:00 a.m. to 6:29 a.m.
- 826:30 a.m. to 6:59 a.m.
- 977:00 a.m. to 7:29 a.m.
- 537:30 a.m. to 7:59 a.m.
- 2628:00 a.m. to 8:29 a.m.
- 2128:30 a.m. to 8:59 a.m.
- 3759:00 a.m. to 9:59 a.m.
- 10710:00 a.m. to 10:59 a.m.
- 2111:00 a.m. to 11:59 a.m.
- 4512:00 p.m. to 3:59 p.m.
- 744:00 p.m. to 11:59 p.m.

Occupations of males:
- Percentage of males in management occupations (except farmers):
Here: 10.5% city: 12.9%
- Percentage of males in business and financial operations occupations:
Here: 13.8% city: 3.9%
- Percentage of males in computer and mathematical occupations:
Here: 26.6% city: 36.0%
- Percentage of males in architecture and engineering occupations:
Here: 9.6% city: 11.7%
- Percentage of males in education, training, and library occupations:
Here: 2.2% city: 1.8%
- Percentage of males in arts, design, entertainment, sports, and media occupations:
Here: 1.2% city: 1.0%
- Percentage of males in healthcare practitioners and technical occupations:
Here: 3.3% city: 1.4%
- Percentage of males in service occupations:
Here: 4.3% city: 6.8%
- Percentage of males in sales and office occupations:
Here: 9.1% city: 9.4%
- Percentage of males in construction, extraction, and maintenance occupations:
Here: 4.5% city: 3.0%
- Percentage of males in production occupations:
Here: 4.8% city: 2.8%
- Percentage of males in transportation occupations:
Here: 1.6% city: 2.9%
- Percentage of males in material moving occupations:
Here: 1.7% city: 1.2%
Occupations of females:
- Percentage of females in management occupations (except farmers):
Here: 13.7% city: 12.6%
- Percentage of females in business and financial operations occupations:
Here: 9.3% city: 9.5%
- Percentage of females in computer and mathematical occupations:
Here: 12.9% city: 17.6%
- Percentage of females in architecture and engineering occupations:
Here: 5.9% city: 5.6%
- Percentage of females in community and social services occupations:
Here: 2.1% city: 1.2%
- Percentage of females in education, training, and library occupations:
Here: 4.9% city: 7.5%
- Percentage of females in arts, design, entertainment, sports, and media occupations:
Here: 5.6% city: 3.5%
- Percentage of females in healthcare practitioners and technical occupations:
Here: 5.6% city: 5.1%
- Percentage of females in service occupations:
Here: 13.7% city: 12.0%
- Percentage of females in sales and office occupations:
Here: 19.0% city: 16.1%
- Percentage of females in production occupations:
Here: 1.2% city: 2.9%
Education in this neighborhood (subdivision or community):
- Percentage of people 3 years and older in K-12 schools:
Downtown Sunnyvale (Downtown): 14.2% Sunnyvale: 12.5%
- Percentage of people 3 years and older in undergraduate colleges:
Downtown Sunnyvale (Downtown): 4.8% Sunnyvale: 5.1%
- Percentage of people 3 years and older in grad. or professional schools:
Downtown Sunnyvale (Downtown): 0.9% Sunnyvale: 2.3%
- Percentage of students K-12 enrolled in private schools:
Downtown Sunnyvale (Downtown): 55.0% Sunnyvale: 14.9%
Percentage of population below poverty level:
| Downtown Sunnyvale (Downtown): | 5.2% |
| Sunnyvale: | 6.2% |
Median year owner moved in (as recorded in 2022):
Median year renter moved in (as recorded in 2022):
| Downtown Sunnyvale (Downtown): | 1998 |
| Sunnyvale: | 2008 |
Median year renter moved in (as recorded in 2022):
| Downtown Sunnyvale (Downtown): | 2017 |
| Sunnyvale: | 2021 |
Percentage of married-couple families with both working:
| Downtown Sunnyvale (Downtown): | 86.3% |
| Sunnyvale: | 69.8% |

- 61.4%Utility gas
- 21.7%Electricity
- 5.2%Bottled, tank, or LP gas
- 4.8%Wood
- 3.3%No fuel used
- 1.9%Other fuel
- 0.9%Solar energy
- 0.8%Fuel oil, kerosene, etc.
Roads and streets:
S Sunnyvale Ave
Length: 0.65 miles
Directions: N-S, SW-NE
Address range: 100 to 599
Directions: N-S, SW-NE
Address range: 100 to 599
Carroll St
Length: 0.64 miles
Directions: N-S, SW-NE
Address range: 100 to 599
Directions: N-S, SW-NE
Address range: 100 to 599
S Mathilda Ave
Length: 0.59 miles
Direction: N-S
Address range: 100 to 573
Direction: N-S
Address range: 100 to 573
W Olive Ave
Length: 0.52 miles
Directions: E-W, SW-NE
Address range: 100 to 699
Directions: E-W, SW-NE
Address range: 100 to 699
S Murphy Ave
Length: 0.49 miles
Directions: E-W, N-S, SW-NE
Address range: 100 to 599
Directions: E-W, N-S, SW-NE
Address range: 100 to 599
S Frances St
Length: 0.45 miles
Direction: N-S
Address range: 100 to 599
Direction: N-S
Address range: 100 to 599
S Taaffe St
Length: 0.36 miles
Directions: N-S, SW-NE
Address range: 100 to 599
Directions: N-S, SW-NE
Address range: 100 to 599
W Iowa Ave
Length: 0.29 miles
Direction: E-W
Address range: 100 to 399
Direction: E-W
Address range: 100 to 399
W Evelyn Ave
Length: 0.29 miles
Directions: E-W, SE-NW
Address range: 100 to 299
Directions: E-W, SE-NW
Address range: 100 to 299
W Washington Ave
Length: 0.29 miles
Direction: E-W
Address range: 100 to 399
Direction: E-W
Address range: 100 to 399
Town Center Ln
Length: 0.24 miles
Directions: N-S, SW-NE
Address range: 300 to 2899
Directions: N-S, SW-NE
Address range: 300 to 2899
All America Way
Length: 0.21 miles
Directions: E-W, N-S, SE-NW
Address range: 400 to 799
Directions: E-W, N-S, SE-NW
Address range: 400 to 799
E Evelyn Ave
Length: 0.15 miles
Direction: E-W
Direction: E-W
E Washington Ave
Length: 0.15 miles
Direction: E-W
Address range: 100 to 299
Direction: E-W
Address range: 100 to 299
E Iowa Ave
Length: 0.14 miles
Direction: E-W
Address range: 100 to 299
Direction: E-W
Address range: 100 to 299
Capella Way
Length: 0.14 miles
Direction: E-W
Address range: 200 to 399
Direction: E-W
Address range: 200 to 399
Altair Way
Length: 0.14 miles
Directions: E-W, N-S, SE-NW
Address range: 300 to 399
Directions: E-W, N-S, SE-NW
Address range: 300 to 399
E Olive Ave
Length: 0.14 miles
Direction: E-W
Address range: 100 to 299
Direction: E-W
Address range: 100 to 299
Aries Way
Length: 0.11 miles
Directions: N-S, SW-NE
Address range: 100 to 199
Directions: N-S, SW-NE
Address range: 100 to 199
E McKinley Ave
Length: 0.08 miles
Direction: E-W
Address range: 200 to 299
Direction: E-W
Address range: 200 to 299
W McKinley Ave
Length: 0.07 miles
Direction: E-W
Address range: 300 to 399
Direction: E-W
Address range: 300 to 399
Old San Francisco Rd
Length: 0.07 miles
Direction: E-W
Address range: 100 to 398
Direction: E-W
Address range: 100 to 398
Mathilda Ave (S Mathilda Ave)
Length: 0.06 miles
Direction: N-S
Address range: 300 to 369
Direction: N-S
Address range: 300 to 369
Agena Way
Length: 0.05 miles
Direction: N-S
Address range: 100 to 198
Direction: N-S
Address range: 100 to 198
Sunnyvale Ave
Length: 0.05 miles
Direction: SW-NE
Direction: SW-NE
Saturn Ter
Length: 0.05 miles
Direction: N-S
Address range: 300 to 399
Direction: N-S
Address range: 300 to 399
Barson Ter
Length: 0.05 miles
Direction: E-W
Address range: 300 to 399
Direction: E-W
Address range: 300 to 399
Booker Ave
Length: 0.04 miles
Direction: E-W
Address range: 300 to 399
Direction: E-W
Address range: 300 to 399
Railroad features:
Union Pacific RR
Length: 0.24 miles
Direction: E-W
Direction: E-W