Downtown Solon (Town Center) neighborhood in Solon, Ohio (OH), 44139 detailed profile
Settings
X


Business Search - 14 Million verified businesses
Area: 0.504 square miles
Population: 486
Population density:
| Downtown Solon (Town Center): | 964 people per square mile |
| Solon: | 1,170 people per square mile |

- 27550.1%White
- 15929.0%Asian
- 7012.8%Hispanic or Latino
- 244.4%Black
- 132.4%Two or more races
- 81.5%Some other race

Median household income in 2022:
| Downtown Solon (Town Center): | $127,509 |
| Solon: | $128,470 |
Distribution of median household income
![Distribution of median household income]()
- 6Less than $10,000
- 5$10,000 to $19,999
- 7$20,000 to $29,999
- 5$30,000 to $39,999
- 5$40,000 to $49,999
- 4$50,000 to $59,999
- 8$60,000 to $74,999
- 25$75,000 to $99,999
- 10$100,000 to $124,999
- 10$125,000 to $149,999
- 12$150,000 to $199,999
- 64$200,000 or more

Distribution of owner-occupied house/condo value
![Distribution of owner-occupied house/condo value]()
- 43Less than $50,000
- 49$50,000 to $99,999
- 4$100,000 to $149,999
- 33$150,000 to $199,999
- 16$200,000 to $249,999
- 15$250,000 to $299,999
- 7$300,000 to $399,999
- 16$400,000 to $499,999
- 30$500,000 to $749,999
- 90$750,000 to $999,999
- 75$1,000,000 or more

Distribution of rent paid by renters
![Distribution of rent paid by renters]()
- 1$400 to $499
- 8$500 to $599
- 2$700 to $799
- 1$800 to $899
- 5$900 to $999
- 8$1,000 to $1,249
- 11$1,250 to $1,499
- 2$1,500 to $1,999
- 33$2,000 or more

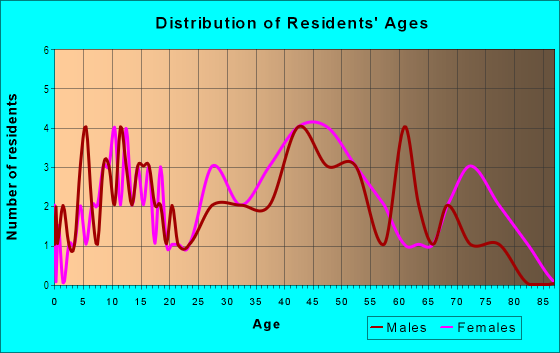
| Males: | 248 |
| Females: | 237 |
Males:
| This neighborhood: | 49.6 years |
| Whole city: | 46.1 years |
| This neighborhood: | 46.3 years |
| Whole city: | 44.3 years |
Average household size:
| Downtown Solon (Town Center): | 15.0 people |
| Solon: | 2.7 people |
Percentage of family households:
| Downtown Solon (Town Center): | 67.4% |
| Solon: | 54.1% |
| Here: | 76.0% |
| Solon: | 67.9% |
Percentage of married-couple families with children (among all households):
| Downtown Solon (Town Center): | 27.9% |
| Solon: | 32.0% |
Percentage of single-mother households (among all households):
| Downtown Solon (Town Center): | 13.0% |
| Solon: | 3.2% |
Percentage of never married males 15 years old and over:
Percentage of never married females 15 years old and over:
| Downtown Solon (Town Center): | 10.1% |
| Solon: | 11.1% |
Percentage of never married females 15 years old and over:
| Downtown Solon (Town Center): | 7.2% |
| city: | 8.3% |
Percentage of people that speak English not well or not at all:
| Downtown Solon (Town Center): | 10.2% |
| Solon: | 2.2% |
Percentage of people born in this state:
Percentage of people born in another U.S. state:
Percentage of native residents but born outside the U.S.:
Percentage of foreign born residents:
| Here: | 65.2% |
| Solon: | 63.8% |
Percentage of people born in another U.S. state:
| Downtown Solon (Town Center): | 13.9% |
| Solon: | 16.5% |
Percentage of native residents but born outside the U.S.:
| Here: | 1.4% |
| city: | 1.0% |
Percentage of foreign born residents:
| Here: | 19.5% |
| Solon: | 18.6% |

Owner-occupied
Renter-occupied


- Rooms in owner-occupied houses and condos in Downtown Solon <
> - 01 room
- 02 rooms
- 03 rooms
- 64 rooms
- 195 rooms
- 136 rooms
- 167 rooms
- 128 rooms
- 629+ rooms

- Rooms in renter-occupied apartments in Downtown Solon <
> - 71 room
- 102 rooms
- 203 rooms
- 14 rooms
- 55 rooms
- 36 rooms
- 37 rooms
- 108 rooms
- 209+ rooms
Owner-occupied
Renter-occupied

- Bedrooms in owner-occupied houses and condos in Downtown Solon <
> - 0no bedroom
- 311 bedroom
- 62 bedrooms
- 473 bedrooms
- 554 bedrooms
- 225+ bedrooms

- Bedrooms in renter-occupied apartments in Downtown Solon <
> - 7no bedroom
- 01 bedroom
- 32 bedrooms
- 93 bedrooms
- 64 bedrooms
- 205+ bedrooms
Average number of cars or other vehicles available in houses/condos:
Average number of cars or other vehicles available in apartments:
| This neighborhood: | 0.7 |
| Solon: | 2.2 |
Average number of cars or other vehicles available in apartments:
| Here: | |
| city: |
Percentage of units with a mortgage:
| Downtown Solon (Town Center): | 63.5% |
| Solon: | 62.1% |
Average estimated value of detached houses in 2022 (92.1% of all units):
| Downtown Solon (Town Center): | $528,405 |
| Ohio: | $254,366 |

- Year house built in Downtown Solon <
> - 32020 or later
- 82010 to 2019
- 562000 to 2009
- 111990 to 1999
- 51980 to 1989
- 141970 to 1979
- 211960 to 1969
- 251950 to 1959
- 41940 to 1949
- 101939 or earlier

City-data.com crime index for city in 2020 (higher means more crime):
| City: | 39.6 |
| U.S. average: | 219.5 |
Travel time to work (commute)
![Travel time to work (commute)]()
- 6Less than 5 minutes
- 215 to 9 minutes
- 1910 to 14 minutes
- 2315 to 19 minutes
- 2520 to 24 minutes
- 1725 to 29 minutes
- 4230 to 34 minutes
- 1035 to 39 minutes
- 1440 to 44 minutes
- 1545 to 59 minutes
- 1160 to 89 minutes
- 290 or more minutes

Means of transportation to work
![Means of transportation to work]()
- 77.4%169Drove a car alone
- 34.8%76Carpooled
- 4.6%10Bus
- 22.9%50Long-distance train or commuter rail
- 11.9%26Walked
- 16.0%35Worked at home

Time leaving home to go to work
![Time leaving home to go to work]()
- 712:00 a.m. to 4:59 a.m.
- 45:00 a.m. to 5:29 a.m.
- 55:30 a.m. to 5:59 a.m.
- 106:00 a.m. to 6:29 a.m.
- 166:30 a.m. to 6:59 a.m.
- 267:00 a.m. to 7:29 a.m.
- 237:30 a.m. to 7:59 a.m.
- 358:00 a.m. to 8:29 a.m.
- 168:30 a.m. to 8:59 a.m.
- 249:00 a.m. to 9:59 a.m.
- 1010:00 a.m. to 10:59 a.m.
- 3311:00 a.m. to 11:59 a.m.
- 312:00 p.m. to 3:59 p.m.
- 94:00 p.m. to 11:59 p.m.

Occupations of males:
- Percentage of males in management occupations (except farmers):
Here: 22.8% city: 18.6%
- Percentage of males in business and financial operations occupations:
Here: 15.5% city: 10.1%
- Percentage of males in computer and mathematical occupations:
Here: 1.5% city: 6.6%
- Percentage of males in life, physical, and social science occupations:
Here: 2.4% city: 2.3%
- Percentage of males in education, training, and library occupations:
Here: 1.5% city: 3.7%
- Percentage of males in healthcare practitioners and technical occupations:
Here: 13.8% city: 10.7%
- Percentage of males in service occupations:
Here: 5.2% city: 8.5%
- Percentage of males in sales and office occupations:
Here: 15.3% city: 15.2%
- Percentage of males in construction, extraction, and maintenance occupations:
Here: 10.2% city: 2.4%
- Percentage of males in transportation occupations:
Here: 7.3% city: 3.8%
Occupations of females:
- Percentage of females in management occupations (except farmers):
Here: 20.5% city: 16.6%
- Percentage of females in business and financial operations occupations:
Here: 6.9% city: 6.3%
- Percentage of females in legal occupations:
Here: 1.6% city: 1.9%
- Percentage of females in education, training, and library occupations:
Here: 6.9% city: 9.0%
- Percentage of females in arts, design, entertainment, sports, and media occupations:
Here: 4.5% city: 1.5%
- Percentage of females in healthcare practitioners and technical occupations:
Here: 16.7% city: 21.5%
- Percentage of females in service occupations:
Here: 18.8% city: 10.6%
- Percentage of females in sales and office occupations:
Here: 22.9% city: 20.6%
- Percentage of females in material moving occupations:
Here: 1.7% city: 2.3%
Percentage of people 16-64 in Armed Forces:
| Downtown Solon (Town Center): | 0.0% |
| Solon: | 0.1% |
Education in this neighborhood (subdivision or community):
- Percentage of people 3 years and older in K-12 schools:
Downtown Solon (Town Center): 33.0% Solon: 20.9%
- Percentage of people 3 years and older in undergraduate colleges:
Downtown Solon (Town Center): 8.5% Solon: 3.3%
- Percentage of people 3 years and older in grad. or professional schools:
Downtown Solon (Town Center): 1.0% Solon: 1.5%
- Percentage of students K-12 enrolled in private schools:
Downtown Solon (Town Center): 46.5% Solon: 8.4%
Percentage of population below poverty level:
| Downtown Solon (Town Center): | 5.5% |
| Solon: | 3.3% |
Median year owner moved in (as recorded in 2022):
| Downtown Solon (Town Center): | 2005 |
| Solon: | 2005 |
Percentage of married-couple families with both working:
| Downtown Solon (Town Center): | 84.1% |
| Solon: | 81.1% |

- 80.2%Utility gas
- 6.5%Electricity
- 3.8%Fuel oil, kerosene, etc.
- 3.0%Bottled, tank, or LP gas
- 3.0%Other fuel
- 2.3%Wood
- 1.1%No fuel used
Highways in this neighborhood:
Aurora Rd (State Rte 43)
Length: 0.77 miles
Directions: E-W, SE-NW
Address range: 32401 to 34301
Directions: E-W, SE-NW
Address range: 32401 to 34301
State Rte 91 (Som Center Rd)
Length: 0.71 miles
Direction: N-S
Address range: 6050 to 6399
Direction: N-S
Address range: 6050 to 6399
US Hwy 422 Alt
Length: 0.66 miles
Directions: E-W, SE-NW
Directions: E-W, SE-NW
Roads and streets:
Solon Rd
Length: 0.79 miles
Directions: E-W, SW-NE
Address range: 32550 to 33999
Directions: E-W, SW-NE
Address range: 32550 to 33999
Bainbridge Rd
Length: 0.73 miles
Directions: E-W, SE-NW
Address range: 32839 to 33998
Directions: E-W, SE-NW
Address range: 32839 to 33998
Kruse Dr
Length: 0.65 miles
Directions: E-W, N-S, SE-NW, SW-NE
Directions: E-W, N-S, SE-NW, SW-NE
Station St
Length: 0.31 miles
Directions: E-W, SE-NW
Address range: 32800 to 33999
Directions: E-W, SE-NW
Address range: 32800 to 33999
Melbury Ave
Length: 0.20 miles
Direction: SW-NE
Address range: 6300 to 6499
Direction: SW-NE
Address range: 6300 to 6499
Solon Blvd
Length: 0.05 miles
Direction: SW-NE
Address range: 6400 to 6440
Direction: SW-NE
Address range: 6400 to 6440
Railroad features:
Conrail RR (Norfolk Southern Rlwy)
Length: 0.72 miles
Direction: SE-NW
Direction: SE-NW
Norfolk and Western Rlwy
Length: 0.02 miles
Direction: SW-NE
Direction: SW-NE