Downtown San Carlos (Downtown) neighborhood in San Carlos, California (CA), 94070 detailed profile
Settings
X


Business Search - 14 Million verified businesses
Area: 0.104 square miles
Population: 104
Population density:
| Downtown San Carlos (Downtown): | 1,002 people per square mile |
| San Carlos: | 5,154 people per square mile |

- 6360.6%White
- 2322.1%Asian
- 1211.5%Two or more races
- 54.8%Hispanic or Latino
- 11.0%Black

Median household income in 2022:
| Downtown San Carlos (Downtown): | $189,622 |
| San Carlos: | $219,413 |
Distribution of median household income
![Distribution of median household income]()
- 2$10,000 to $19,999
- 3$20,000 to $29,999
- 1$30,000 to $39,999
- 3$40,000 to $49,999
- 1$50,000 to $59,999
- 3$60,000 to $74,999
- 4$75,000 to $99,999
- 1$100,000 to $124,999
- 1$125,000 to $149,999
- 2$150,000 to $199,999
- 27$200,000 or more

Distribution of owner-occupied house/condo value
![Distribution of owner-occupied house/condo value]()
- 4Less than $50,000
- 2$50,000 to $99,999
- 2$200,000 to $249,999
- 1$500,000 to $749,999
- 3$750,000 to $999,999
- 25$1,000,000 or more

Distribution of rent paid by renters
![Distribution of rent paid by renters]()
- 4$700 to $799
- 2$900 to $999
- 2$1,000 to $1,249
- 1$1,500 to $1,999
- 11$2,000 or more

Median rent in 2022:
| Downtown San Carlos (Downtown): | $3,458 |
| San Carlos: | $2,001 |
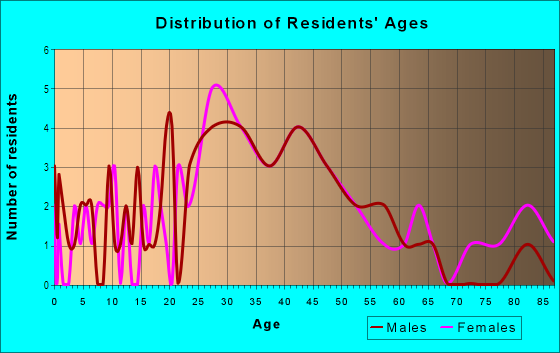
| Males: | 51 |
| Females: | 53 |
Males:
| This neighborhood: | 40.3 years |
| Whole city: | 39.6 years |
| This neighborhood: | 36.5 years |
| Whole city: | 44.0 years |
Average household size:
| Downtown San Carlos (Downtown): | 2.6 people |
| San Carlos: | 2.7 people |
Percentage of family households:
| Downtown San Carlos (Downtown): | 66.2% |
| San Carlos: | 54.7% |
| Here: | 65.1% |
| San Carlos: | 61.9% |
Percentage of married-couple families with children (among all households):
| Downtown San Carlos (Downtown): | 33.2% |
| San Carlos: | 33.0% |
Percentage of single-mother households (among all households):
| Downtown San Carlos (Downtown): | 1.2% |
| San Carlos: | 3.1% |
Percentage of never married males 15 years old and over:
Percentage of never married females 15 years old and over:
| Downtown San Carlos (Downtown): | 11.2% |
| San Carlos: | 14.0% |
Percentage of never married females 15 years old and over:
| Downtown San Carlos (Downtown): | 3.9% |
| city: | 10.8% |
Percentage of people that speak English not well or not at all:
| Downtown San Carlos (Downtown): | 0.0% |
| San Carlos: | 1.7% |
Percentage of people born in this state:
Percentage of people born in another U.S. state:
Percentage of native residents but born outside the U.S.:
Percentage of foreign born residents:
| Here: | 54.4% |
| San Carlos: | 51.9% |
Percentage of people born in another U.S. state:
| Downtown San Carlos (Downtown): | 15.4% |
| San Carlos: | 22.3% |
Percentage of native residents but born outside the U.S.:
| Here: | 3.4% |
| city: | 1.4% |
Percentage of foreign born residents:
| Here: | 26.8% |
| San Carlos: | 24.4% |

Owner-occupied
Renter-occupied


- Rooms in owner-occupied houses and condos in Downtown San Carlos <
> - 01 room
- 02 rooms
- 23 rooms
- 54 rooms
- 75 rooms
- 56 rooms
- 47 rooms
- 38 rooms
- 09+ rooms

- Rooms in renter-occupied apartments in Downtown San Carlos <
> - 31 room
- 02 rooms
- 03 rooms
- 74 rooms
- 15 rooms
- 46 rooms
- 07 rooms
- 18 rooms
- 09+ rooms
Owner-occupied
Renter-occupied

- Bedrooms in owner-occupied houses and condos in Downtown San Carlos <
> - 0no bedroom
- 51 bedroom
- 62 bedrooms
- 163 bedrooms
- 24 bedrooms
- 25+ bedrooms

- Bedrooms in renter-occupied apartments in Downtown San Carlos <
> - 3no bedroom
- 01 bedroom
- 92 bedrooms
- 23 bedrooms
- 04 bedrooms
- 05+ bedrooms
Average number of cars or other vehicles available in houses/condos:
Average number of cars or other vehicles available in apartments:
| This neighborhood: | 2.1 |
| San Carlos: | 2.1 |
Average number of cars or other vehicles available in apartments:
| Here: | 1.9 |
| city: | 1.6 |
Percentage of units with a mortgage:
| Downtown San Carlos (Downtown): | 67.8% |
| San Carlos: | 72.9% |

- Year house built in Downtown San Carlos <
> - 02020 or later
- 12010 to 2019
- 02000 to 2009
- 21990 to 1999
- 61980 to 1989
- 01970 to 1979
- 21960 to 1969
- 21950 to 1959
- 231940 to 1949
- 61939 or earlier

Travel time to work (commute)
![Travel time to work (commute)]()
- 65 to 9 minutes
- 810 to 14 minutes
- 715 to 19 minutes
- 520 to 24 minutes
- 225 to 29 minutes
- 1430 to 34 minutes
- 340 to 44 minutes
- 245 to 59 minutes
- 660 to 89 minutes

Means of transportation to work
![Means of transportation to work]()
- 42.5%28Drove a car alone
- 3.0%2Carpooled
- 3.0%2Subway or elevated rail
- 4.6%3Long-distance train or commuter rail
- 44.0%29Worked at home

Time leaving home to go to work
![Time leaving home to go to work]()
- 212:00 a.m. to 4:59 a.m.
- 25:30 a.m. to 5:59 a.m.
- 76:30 a.m. to 6:59 a.m.
- 57:00 a.m. to 7:29 a.m.
- 77:30 a.m. to 7:59 a.m.
- 138:00 a.m. to 8:29 a.m.
- 18:30 a.m. to 8:59 a.m.
- 149:00 a.m. to 9:59 a.m.

Occupations of males:
- Percentage of males in management occupations (except farmers):
Here: 14.9% city: 23.2%
- Percentage of males in business and financial operations occupations:
Here: 5.6% city: 9.0%
- Percentage of males in computer and mathematical occupations:
Here: 16.2% city: 14.4%
- Percentage of males in architecture and engineering occupations:
Here: 14.3% city: 6.6%
- Percentage of males in life, physical, and social science occupations:
Here: 2.8% city: 3.4%
- Percentage of males in arts, design, entertainment, sports, and media occupations:
Here: 6.2% city: 1.2%
- Percentage of males in service occupations:
Here: 6.0% city: 7.9%
- Percentage of males in sales and office occupations:
Here: 14.8% city: 8.4%
- Percentage of males in construction, extraction, and maintenance occupations:
Here: 1.5% city: 4.5%
- Percentage of males in production occupations:
Here: 5.9% city: 1.9%
- Percentage of males in transportation occupations:
Here: 9.8% city: 1.9%
Occupations of females:
- Percentage of females in management occupations (except farmers):
Here: 25.2% city: 20.0%
- Percentage of females in business and financial operations occupations:
Here: 5.8% city: 14.0%
- Percentage of females in computer and mathematical occupations:
Here: 2.2% city: 4.6%
- Percentage of females in life, physical, and social science occupations:
Here: 5.9% city: 3.0%
- Percentage of females in community and social services occupations:
Here: 2.6% city: 2.1%
- Percentage of females in legal occupations:
Here: 7.0% city: 4.2%
- Percentage of females in education, training, and library occupations:
Here: 8.8% city: 7.7%
- Percentage of females in arts, design, entertainment, sports, and media occupations:
Here: 8.9% city: 3.0%
- Percentage of females in healthcare practitioners and technical occupations:
Here: 2.5% city: 9.7%
- Percentage of females in service occupations:
Here: 24.9% city: 10.9%
- Percentage of females in sales and office occupations:
Here: 4.4% city: 16.2%
- Percentage of females in production occupations:
Here: 1.6% city: 0.7%
Education in this neighborhood (subdivision or community):
- Percentage of people 3 years and older in K-12 schools:
Downtown San Carlos (Downtown): 14.0% San Carlos: 18.2%
- Percentage of people 3 years and older in undergraduate colleges:
Downtown San Carlos (Downtown): 4.0% San Carlos: 3.7%
- Percentage of people 3 years and older in grad. or professional schools:
Downtown San Carlos (Downtown): 5.0% San Carlos: 1.0%
- Percentage of students K-12 enrolled in private schools:
Downtown San Carlos (Downtown): 7.1% San Carlos: 15.3%
Percentage of population below poverty level:
| Downtown San Carlos (Downtown): | 1.9% |
| San Carlos: | 3.0% |
Median year owner moved in (as recorded in 2022):
Median year renter moved in (as recorded in 2022):
| Downtown San Carlos (Downtown): | 2006 |
| San Carlos: | 2005 |
Median year renter moved in (as recorded in 2022):
| Downtown San Carlos (Downtown): | 2010 |
| San Carlos: | 2016 |
Percentage of married-couple families with both working:
| Downtown San Carlos (Downtown): | 68.6% |
| San Carlos: | 78.7% |

- 79.7%Utility gas
- 12.8%Electricity
- 5.9%Bottled, tank, or LP gas
- 1.7%No fuel used
Highways in this neighborhood:
el Camino Real (State Hwy 82)
Length: 0.58 miles
Direction: SE-NW
Direction: SE-NW
Roads and streets:
Laurel St
Length: 0.56 miles
Direction: SE-NW
Address range: 500 to 899
Direction: SE-NW
Address range: 500 to 899
Walnut St
Length: 0.50 miles
Direction: SE-NW
Address range: 500 to 899
Direction: SE-NW
Address range: 500 to 899
Old County Rd
Length: 0.47 miles
Direction: SE-NW
Address range: 501 to 799
Direction: SE-NW
Address range: 501 to 799
Holly St
Length: 0.21 miles
Direction: SW-NE
Address range: 1062 to 1299
Direction: SW-NE
Address range: 1062 to 1299
San Carlos Ave
Length: 0.16 miles
Direction: SW-NE
Address range: 1100 to 1299
Direction: SW-NE
Address range: 1100 to 1299
Cherry St
Length: 0.16 miles
Direction: SW-NE
Address range: 1100 to 1299
Direction: SW-NE
Address range: 1100 to 1299
Olive St
Length: 0.16 miles
Direction: SW-NE
Address range: 1100 to 1327
Direction: SW-NE
Address range: 1100 to 1327
Arroyo Ave
Length: 0.14 miles
Direction: SW-NE
Address range: 1100 to 1299
Direction: SW-NE
Address range: 1100 to 1299
Railroad features:
Caltrain
Length: 0.34 miles
Direction: SE-NW
Direction: SE-NW
Joint Powers Authority RR (Union Pacific RR)
Length: 0.28 miles
Direction: SE-NW
Direction: SE-NW
Freight
Length: 0.06 miles
Directions: E-W, N-S, SE-NW
Directions: E-W, N-S, SE-NW