Downtown neighborhood in Mount Prospect, Illinois (IL), 60056 detailed profile
Settings
X


Business Search - 14 Million verified businesses
Area: 0.422 square miles
Population: 2,623
Population density:
| Downtown: | 6,209 people per square mile |
| Mount Prospect: | 5,506 people per square mile |

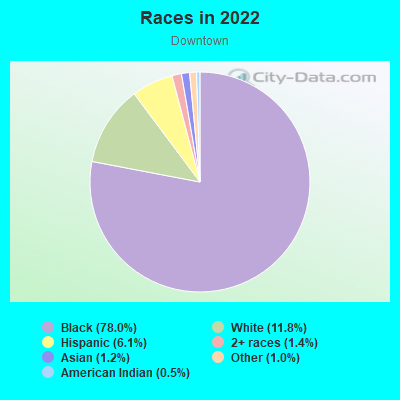
- 2,21379.4%White
- 2027.2%Asian
- 1244.4%Hispanic or Latino
- 1043.7%Black
- 722.6%Two or more races
- 712.5%Some other race
- 20.07%American Indian
Distribution of median household income
![Distribution of median household income]()
- 73Less than $10,000
- 70$10,000 to $19,999
- 83$20,000 to $29,999
- 105$30,000 to $39,999
- 63$40,000 to $49,999
- 57$50,000 to $59,999
- 42$60,000 to $74,999
- 85$75,000 to $99,999
- 188$100,000 to $124,999
- 173$125,000 to $149,999
- 154$150,000 to $199,999
- 198$200,000 or more

Distribution of owner-occupied house/condo value
![Distribution of owner-occupied house/condo value]()
- 51Less than $50,000
- 77$50,000 to $99,999
- 83$100,000 to $149,999
- 157$150,000 to $199,999
- 69$200,000 to $249,999
- 95$250,000 to $299,999
- 227$300,000 to $399,999
- 251$400,000 to $499,999
- 83$500,000 to $749,999
- 131$750,000 to $999,999
- 3$1,000,000 or more

Distribution of rent paid by renters
![Distribution of rent paid by renters]()
- 24$100 to $199
- 6$600 to $699
- 41$800 to $899
- 9$900 to $999
- 69$1,000 to $1,249
- 4$1,250 to $1,499
- 81$1,500 to $1,999
- 144$2,000 or more

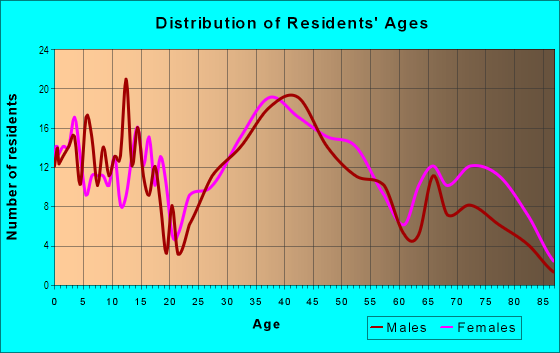
| Males: | 1,148 |
| Females: | 1,474 |
Males:
| This neighborhood: | 43.8 years |
| Whole city: | 40.2 years |
| This neighborhood: | 39.0 years |
| Whole city: | 43.0 years |
Average household size:
| Downtown: | 2.6 people |
| Mount Prospect: | 2.6 people |
Percentage of family households:
| Downtown: | 57.3% |
| Mount Prospect: | 47.7% |
| Here: | 54.5% |
| Mount Prospect: | 56.3% |
Percentage of married-couple families with children (among all households):
| Downtown: | 31.1% |
| Mount Prospect: | 33.0% |
Percentage of single-mother households (among all households):
| Downtown: | 6.8% |
| Mount Prospect: | 5.6% |
Percentage of never married males 15 years old and over:
Percentage of never married females 15 years old and over:
| Downtown: | 8.2% |
| Mount Prospect: | 14.5% |
Percentage of never married females 15 years old and over:
| Downtown: | 14.6% |
| village: | 11.8% |
Percentage of people that speak English not well or not at all:
| Downtown: | 0.8% |
| Mount Prospect: | 7.1% |
Percentage of people born in this state:
Percentage of people born in another U.S. state:
Percentage of native residents but born outside the U.S.:
Percentage of foreign born residents:
| Here: | 75.6% |
| Mount Prospect: | 59.4% |
Percentage of people born in another U.S. state:
| Downtown: | 15.2% |
| Mount Prospect: | 9.8% |
Percentage of native residents but born outside the U.S.:
| Here: | 0.7% |
| village: | 0.8% |
Percentage of foreign born residents:
| Here: | 8.6% |
| Mount Prospect: | 30.0% |
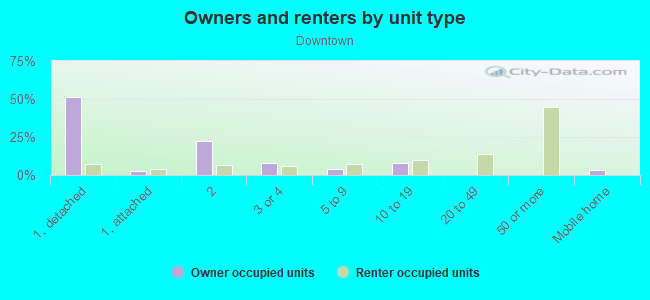
Owner-occupied
Renter-occupied

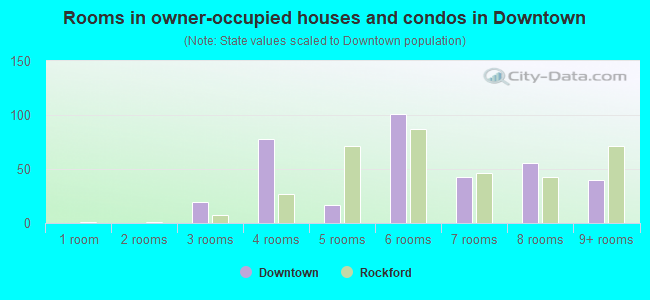
- Rooms in owner-occupied houses and condos in Downtown
- 1011 room
- 542 rooms
- 1183 rooms
- 1794 rooms
- 1555 rooms
- 1356 rooms
- 2017 rooms
- 1048 rooms
- 959+ rooms
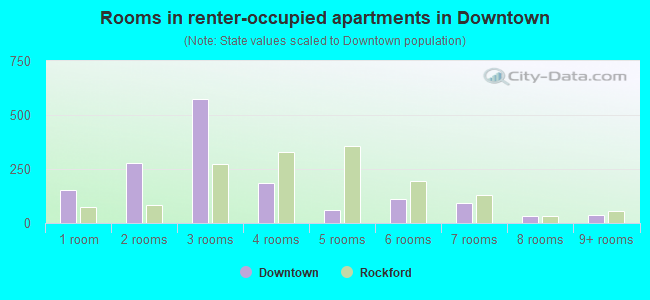
- Rooms in renter-occupied apartments in Downtown
- 631 room
- 702 rooms
- 813 rooms
- 294 rooms
- 675 rooms
- 406 rooms
- 607 rooms
- 218 rooms
- 39+ rooms
Owner-occupied
Renter-occupied
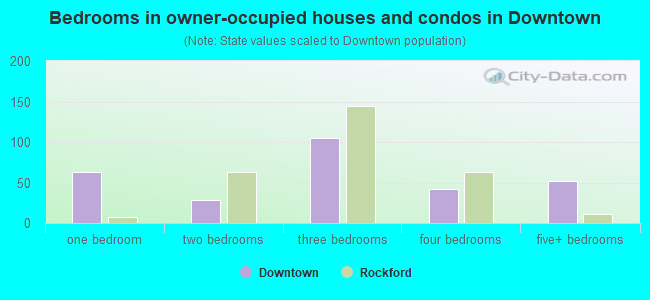
- Bedrooms in owner-occupied houses and condos in Downtown
- 136no bedroom
- 1301 bedroom
- 1702 bedrooms
- 4283 bedrooms
- 1474 bedrooms
- 435+ bedrooms
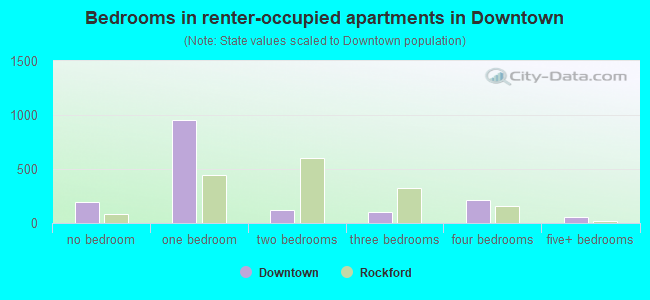
- Bedrooms in renter-occupied apartments in Downtown
- 63no bedroom
- 701 bedroom
- 1062 bedrooms
- 1563 bedrooms
- 184 bedrooms
- 05+ bedrooms
Average number of cars or other vehicles available in houses/condos:
Average number of cars or other vehicles available in apartments:
| This neighborhood: | 1.8 |
| Mount Prospect: | 1.9 |
Average number of cars or other vehicles available in apartments:
| Here: | |
| village: |
Percentage of units with a mortgage:
| Downtown: | 66.4% |
| Mount Prospect: | 59.5% |
Housing prices:
- Average estimated value of detached houses in 2022 (64.4% of all units):
Downtown: $349,921 Illinois: $310,164
- Average estimated '22 value of housing units in 5-or-more-unit structures (39.0% of all units):
Downtown: $169,503 Illinois: $318,887
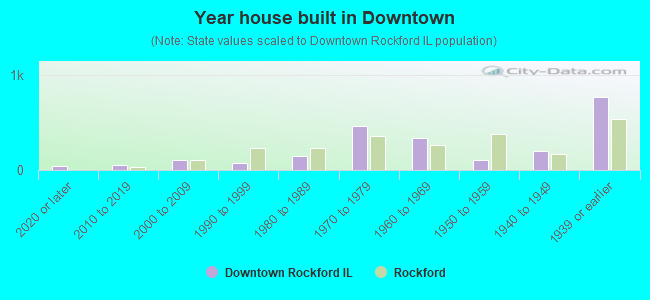
- Year house built in Downtown
- 532020 or later
- 852010 to 2019
- 5312000 to 2009
- 1861990 to 1999
- 761980 to 1989
- 751970 to 1979
- 961960 to 1969
- 2981950 to 1959
- 571940 to 1949
- 1891939 or earlier
City-data.com crime index for village in 2020 (higher means more crime):
| City: | 52.8 |
| U.S. average: | 219.5 |
Travel time to work (commute)
![Travel time to work (commute)]()
- 6Less than 5 minutes
- 915 to 9 minutes
- 12410 to 14 minutes
- 8615 to 19 minutes
- 12620 to 24 minutes
- 8925 to 29 minutes
- 15330 to 34 minutes
- 4435 to 39 minutes
- 4940 to 44 minutes
- 11845 to 59 minutes
- 10160 to 89 minutes
- 2790 or more minutes

Means of transportation to work
![Means of transportation to work]()
- 66.0%857Drove a car alone
- 5.8%75Carpooled
- 3.0%39Subway or elevated rail
- 10.9%141Long-distance train or commuter rail
- 0.4%5Taxi
- 1.8%23Motorcycle
- 3.2%41Bicycle
- 3.8%49Walked
- 0.3%4Other means
- 17.2%223Worked at home

Time leaving home to go to work
![Time leaving home to go to work]()
- 2512:00 a.m. to 4:59 a.m.
- 215:00 a.m. to 5:29 a.m.
- 545:30 a.m. to 5:59 a.m.
- 776:00 a.m. to 6:29 a.m.
- 1376:30 a.m. to 6:59 a.m.
- 2127:00 a.m. to 7:29 a.m.
- 1417:30 a.m. to 7:59 a.m.
- 1368:00 a.m. to 8:29 a.m.
- 328:30 a.m. to 8:59 a.m.
- 549:00 a.m. to 9:59 a.m.
- 1610:00 a.m. to 10:59 a.m.
- 1911:00 a.m. to 11:59 a.m.
- 8912:00 p.m. to 3:59 p.m.
- 534:00 p.m. to 11:59 p.m.

Occupations of males:
- Percentage of males in management occupations (except farmers):
Here: 19.9% village: 15.1%
- Percentage of males in business and financial operations occupations:
Here: 16.5% village: 5.5%
- Percentage of males in computer and mathematical occupations:
Here: 5.4% village: 6.6%
- Percentage of males in architecture and engineering occupations:
Here: 6.0% village: 4.4%
- Percentage of males in legal occupations:
Here: 2.7% village: 1.5%
- Percentage of males in education, training, and library occupations:
Here: 4.6% village: 3.3%
- Percentage of males in arts, design, entertainment, sports, and media occupations:
Here: 4.6% village: 2.0%
- Percentage of males in service occupations:
Here: 2.8% village: 12.2%
- Percentage of males in sales and office occupations:
Here: 11.6% village: 12.8%
- Percentage of males in construction, extraction, and maintenance occupations:
Here: 8.2% village: 8.6%
- Percentage of males in production occupations:
Here: 3.2% village: 9.5%
- Percentage of males in transportation occupations:
Here: 3.3% village: 6.3%
Occupations of females:
- Percentage of females in management occupations (except farmers):
Here: 20.1% village: 12.7%
- Percentage of females in business and financial operations occupations:
Here: 8.7% village: 7.9%
- Percentage of females in computer and mathematical occupations:
Here: 5.5% village: 3.8%
- Percentage of females in life, physical, and social science occupations:
Here: 2.0% village: 0.3%
- Percentage of females in community and social services occupations:
Here: 4.8% village: 1.0%
- Percentage of females in legal occupations:
Here: 2.4% village: 1.1%
- Percentage of females in education, training, and library occupations:
Here: 10.8% village: 9.9%
- Percentage of females in arts, design, entertainment, sports, and media occupations:
Here: 3.1% village: 1.5%
- Percentage of females in healthcare practitioners and technical occupations:
Here: 7.9% village: 10.6%
- Percentage of females in service occupations:
Here: 13.7% village: 14.9%
- Percentage of females in sales and office occupations:
Here: 19.2% village: 28.0%
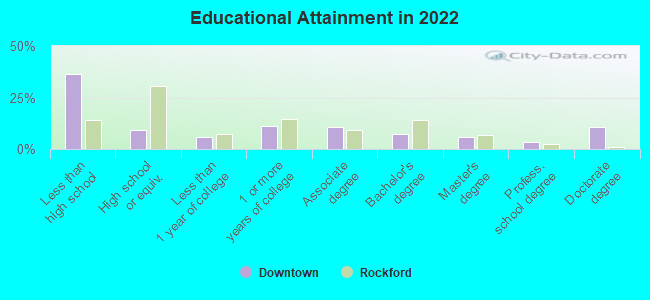
Education in this neighborhood (subdivision or community):
- Percentage of people 3 years and older in K-12 schools:
Downtown: 28.7% Mount Prospect: 16.1%
- Percentage of people 3 years and older in undergraduate colleges:
Downtown: 2.0% Mount Prospect: 3.5%
- Percentage of people 3 years and older in grad. or professional schools:
Downtown: 3.7% Mount Prospect: 1.5%
- Percentage of students K-12 enrolled in private schools:
Downtown: 57.6% Mount Prospect: 7.9%
Percentage of population below poverty level:
| Downtown: | 4.4% |
| Mount Prospect: | 5.0% |
Median year owner moved in (as recorded in 2022):
| Downtown: | 2007 |
| Mount Prospect: | 2005 |
Percentage of married-couple families with both working:
| Downtown: | 82.5% |
| Mount Prospect: | 71.6% |
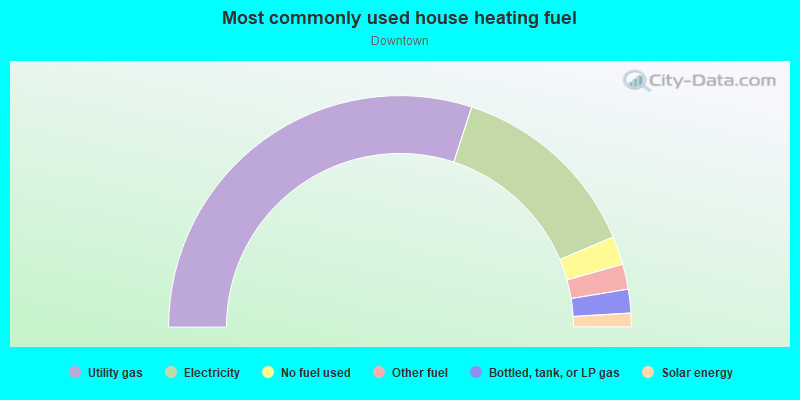
- 74.9%Utility gas
- 10.8%Electricity
- 6.2%No fuel used
- 6.1%Bottled, tank, or LP gas
- 2.0%Other fuel
Highways in this neighborhood:
US Hwy 14 (E Northwest Hwy)
Length: 0.61 miles
Directions: E-W, SE-NW
Address range: 1 to 598
Directions: E-W, SE-NW
Address range: 1 to 598
State Rte 83 (W Lincoln St)
Length: 0.49 miles
Directions: E-W, SE-NW, SW-NE
Address range: 1 to 499
Directions: E-W, SE-NW, SW-NE
Address range: 1 to 499
State Rte 83 (S Main St)
Length: 0.48 miles
Direction: N-S
Address range: 1 to 399
Direction: N-S
Address range: 1 to 399
US Hwy 14 (W Northwest Hwy)
Length: 0.47 miles
Directions: E-W, SE-NW
Directions: E-W, SE-NW
Roads and streets:
E Prospect Ave
Length: 0.61 miles
Directions: E-W, SE-NW
Directions: E-W, SE-NW
E Busse Ave
Length: 0.57 miles
Direction: E-W
Address range: 1 to 599
Direction: E-W
Address range: 1 to 599
E Central Rd
Length: 0.57 miles
Direction: E-W
Address range: 1 to 598
Direction: E-W
Address range: 1 to 598
W Prospect Ave
Length: 0.53 miles
Directions: E-W, SE-NW
Address range: 1 to 499
Directions: E-W, SE-NW
Address range: 1 to 499
W Central Rd
Length: 0.50 miles
Direction: E-W
Address range: 1 to 499
Direction: E-W
Address range: 1 to 499
S Emerson St
Length: 0.48 miles
Direction: N-S
Address range: 1 to 399
Direction: N-S
Address range: 1 to 399
W Evergreen Ave
Length: 0.48 miles
Direction: E-W
Address range: 1 to 499
Direction: E-W
Address range: 1 to 499
W Milburn Ave
Length: 0.48 miles
Direction: E-W
Address range: 1 to 499
Direction: E-W
Address range: 1 to 499
S Hi Lusi Ave
Length: 0.47 miles
Direction: N-S
Address range: 1 to 399
Direction: N-S
Address range: 1 to 399
S School St
Length: 0.46 miles
Directions: N-S, SW-NE
Address range: 1 to 399
Directions: N-S, SW-NE
Address range: 1 to 399
S Elmhurst Ave
Length: 0.44 miles
Direction: N-S
Address range: 1 to 399
Direction: N-S
Address range: 1 to 399
S Pine St
Length: 0.44 miles
Direction: N-S
Address range: 1 to 399
Direction: N-S
Address range: 1 to 399
S William St
Length: 0.44 miles
Directions: N-S, SW-NE
Address range: 1 to 399
Directions: N-S, SW-NE
Address range: 1 to 399
S Wille St
Length: 0.43 miles
Directions: N-S, SW-NE
Address range: 1 to 399
Directions: N-S, SW-NE
Address range: 1 to 399
S I Oka Ave
Length: 0.43 miles
Direction: N-S
Address range: 1 to 399
Direction: N-S
Address range: 1 to 399
S Maple St
Length: 0.43 miles
Directions: N-S, SE-NW
Address range: 1 to 409
Directions: N-S, SE-NW
Address range: 1 to 409
S Owen St
Length: 0.40 miles
Directions: N-S, SE-NW, SW-NE
Address range: 1 to 399
Directions: N-S, SE-NW, SW-NE
Address range: 1 to 399
S Elm St
Length: 0.39 miles
Directions: N-S, SE-NW, SW-NE
Address range: 1 to 273
Directions: N-S, SE-NW, SW-NE
Address range: 1 to 273
E Lincoln St
Length: 0.38 miles
Directions: E-W, SE-NW
Address range: 1 to 399
Directions: E-W, SE-NW
Address range: 1 to 399
E Evergreen Ave
Length: 0.30 miles
Directions: E-W, N-S, SW-NE
Address range: 100 to 599
Directions: E-W, N-S, SW-NE
Address range: 100 to 599
W Busse Ave
Length: 0.29 miles
Direction: E-W
Address range: 1 to 499
Direction: E-W
Address range: 1 to 499
E Milburn Ave
Length: 0.19 miles
Directions: E-W, SW-NE
Address range: 1 to 599
Directions: E-W, SW-NE
Address range: 1 to 599
E Evergreen Ave (College Dr)
Length: 0.06 miles
Direction: E-W
Address range: 202 to 299
Direction: E-W
Address range: 202 to 299
Village Dr
Length: 0.05 miles
Direction: SE-NW
Address range: 200 to 299
Direction: SE-NW
Address range: 200 to 299
University Dr
Length: 0.05 miles
Direction: E-W
Address range: 200 to 299
Direction: E-W
Address range: 200 to 299
Railroad features:
Chicago and North Western RR
Length: 0.62 miles
Direction: SE-NW
Direction: SE-NW