Downtown neighborhood in Morris, Illinois (IL), 60450 detailed profile
Settings
X


Business Search - 14 Million verified businesses
Area: 0.241 square miles
Population: 630
Population density:
| Downtown: | 2,615 people per square mile |
| Morris: | 2,107 people per square mile |

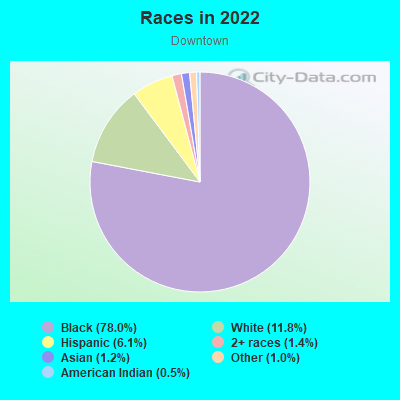
- 54177.6%White
- 547.7%Hispanic or Latino
- 497.0%Two or more races
- 314.4%Black
- 223.2%Asian
Median household income in 2022:
| Downtown: | $67,107 |
| Morris: | $73,909 |
Distribution of median household income
![Distribution of median household income]()
- 16Less than $10,000
- 51$10,000 to $19,999
- 33$20,000 to $29,999
- 55$30,000 to $39,999
- 66$40,000 to $49,999
- 10$50,000 to $59,999
- 50$60,000 to $74,999
- 43$75,000 to $99,999
- 6$100,000 to $124,999
- 56$125,000 to $149,999
- 20$150,000 to $199,999
- 8$200,000 or more

Distribution of owner-occupied house/condo value
![Distribution of owner-occupied house/condo value]()
- 28Less than $50,000
- 12$50,000 to $99,999
- 181$100,000 to $149,999
- 36$150,000 to $199,999
- 28$200,000 to $249,999
- 29$250,000 to $299,999
- 12$300,000 to $399,999
- 25$400,000 to $499,999
- 1$500,000 to $749,999

Distribution of rent paid by renters
![Distribution of rent paid by renters]()
- 31$300 to $399
- 11$400 to $499
- 19$500 to $599
- 28$600 to $699
- 32$700 to $799
- 11$800 to $899
- 85$900 to $999
- 76$1,000 to $1,249
- 38$1,250 to $1,499
- 54$1,500 to $1,999

Median rent in 2022:
| Downtown: | $1,016 |
| Morris: | $992 |
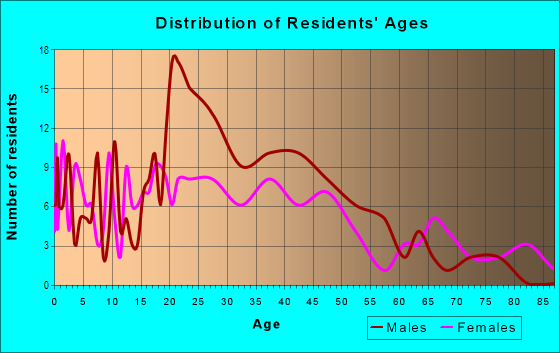
| Males: | 359 |
| Females: | 270 |
Males:
| This neighborhood: | 37.3 years |
| Whole city: | 38.7 years |
| This neighborhood: | 39.5 years |
| Whole city: | 40.2 years |
Average household size:
| Downtown: | 2.2 people |
| Morris: | 2.3 people |
Percentage of family households:
| Downtown: | 37.5% |
| Morris: | 46.0% |
| Here: | 35.1% |
| Morris: | 46.6% |
Percentage of married-couple families with children (among all households):
| Downtown: | 46.6% |
| Morris: | 32.3% |
Percentage of single-mother households (among all households):
| Downtown: | 53.9% |
| Morris: | 6.1% |
Percentage of never married males 15 years old and over:
Percentage of never married females 15 years old and over:
| Downtown: | 16.3% |
| Morris: | 15.6% |
Percentage of never married females 15 years old and over:
| Downtown: | 13.0% |
| city: | 13.2% |
Percentage of people that speak English not well or not at all:
| Downtown: | 1.1% |
| Morris: | 1.1% |
Percentage of people born in this state:
Percentage of people born in another U.S. state:
Percentage of native residents but born outside the U.S.:
Percentage of foreign born residents:
| Here: | 82.2% |
| Morris: | 81.3% |
Percentage of people born in another U.S. state:
| Downtown: | 15.3% |
| Morris: | 14.2% |
Percentage of native residents but born outside the U.S.:
| Here: | 0.4% |
| city: | 0.6% |
Percentage of foreign born residents:
| Here: | 2.2% |
| Morris: | 4.0% |
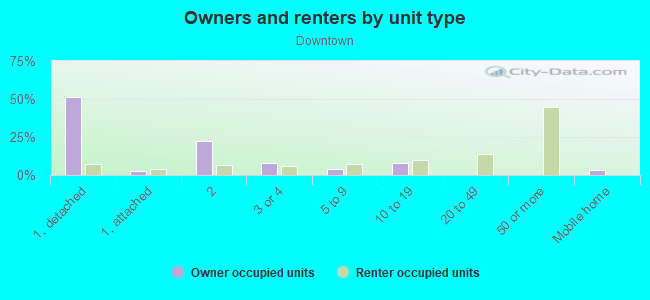
Owner-occupied
Renter-occupied

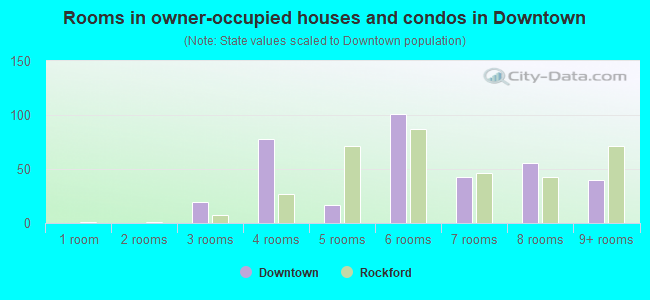
- Rooms in owner-occupied houses and condos in Downtown
- 01 room
- 02 rooms
- 313 rooms
- 84 rooms
- 585 rooms
- 276 rooms
- 137 rooms
- 398 rooms
- 139+ rooms
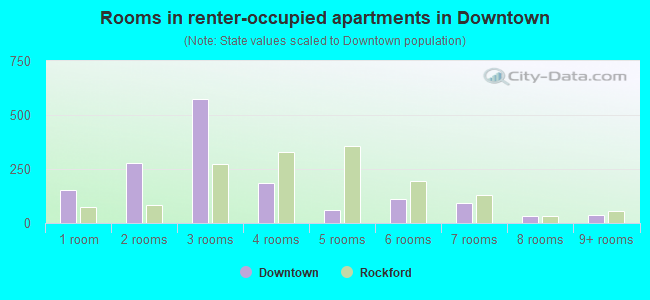
- Rooms in renter-occupied apartments in Downtown
- 161 room
- 302 rooms
- 313 rooms
- 484 rooms
- 1265 rooms
- 146 rooms
- 37 rooms
- 138 rooms
- 1139+ rooms
Owner-occupied
Renter-occupied
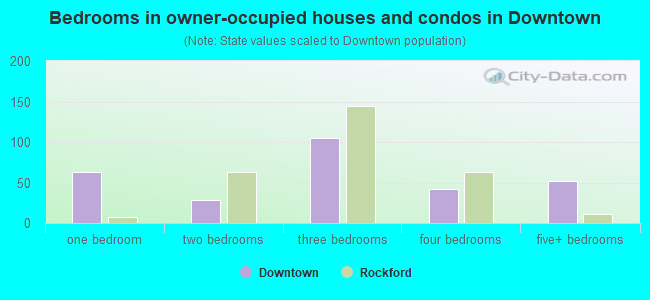
- Bedrooms in owner-occupied houses and condos in Downtown
- 0no bedroom
- 01 bedroom
- 92 bedrooms
- 503 bedrooms
- 254 bedrooms
- 75+ bedrooms
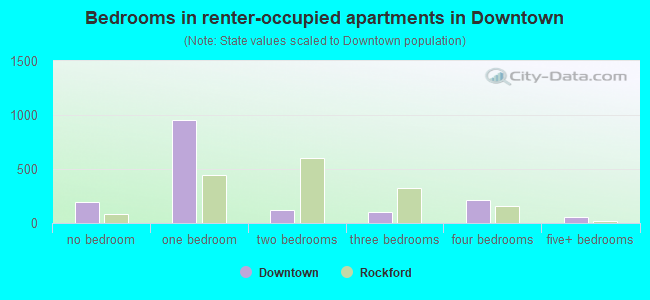
- Bedrooms in renter-occupied apartments in Downtown
- 24no bedroom
- 441 bedroom
- 2162 bedrooms
- 93 bedrooms
- 884 bedrooms
- 05+ bedrooms
Average number of cars or other vehicles available in houses/condos:
Average number of cars or other vehicles available in apartments:
| This neighborhood: | 1.8 |
| Morris: | 2.0 |
Average number of cars or other vehicles available in apartments:
| Here: | 1.3 |
| city: | 1.3 |
Percentage of units with a mortgage:
| Downtown: | 72.6% |
| Morris: | 66.4% |
Average estimated value of detached houses in 2022 (48.7% of all units):
| Downtown: | $257,743 |
| Illinois: | $310,164 |
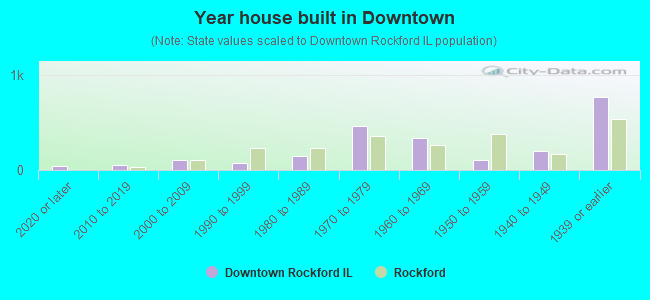
- Year house built in Downtown
- 02020 or later
- 182010 to 2019
- 322000 to 2009
- 351990 to 1999
- 271980 to 1989
- 561970 to 1979
- 101960 to 1969
- 281950 to 1959
- 281940 to 1949
- 1171939 or earlier
City-data.com crime index for city in 2020 (higher means more crime):
| City: | 153.9 |
| U.S. average: | 219.5 |
Travel time to work (commute)
![Travel time to work (commute)]()
- 9Less than 5 minutes
- 605 to 9 minutes
- 4210 to 14 minutes
- 2615 to 19 minutes
- 2820 to 24 minutes
- 1625 to 29 minutes
- 3530 to 34 minutes
- 635 to 39 minutes
- 340 to 44 minutes
- 2745 to 59 minutes
- 460 to 89 minutes
- 1290 or more minutes

Means of transportation to work
![Means of transportation to work]()
- 81.4%258Drove a car alone
- 8.5%27Carpooled
- 18.9%60Long-distance train or commuter rail
- 0.9%3Bicycle
- 2.5%8Walked
- 21.8%69Other means
- 18.3%58Worked at home

Time leaving home to go to work
![Time leaving home to go to work]()
- 3012:00 a.m. to 4:59 a.m.
- 135:00 a.m. to 5:29 a.m.
- 195:30 a.m. to 5:59 a.m.
- 296:00 a.m. to 6:29 a.m.
- 296:30 a.m. to 6:59 a.m.
- 467:00 a.m. to 7:29 a.m.
- 117:30 a.m. to 7:59 a.m.
- 78:00 a.m. to 8:29 a.m.
- 128:30 a.m. to 8:59 a.m.
- 159:00 a.m. to 9:59 a.m.
- 210:00 a.m. to 10:59 a.m.
- 1311:00 a.m. to 11:59 a.m.
- 1512:00 p.m. to 3:59 p.m.
- 274:00 p.m. to 11:59 p.m.

Occupations of males:
- Percentage of males in management occupations (except farmers):
Here: 12.2% city: 9.3%
- Percentage of males in life, physical, and social science occupations:
Here: 8.8% city: 3.2%
- Percentage of males in community and social services occupations:
Here: 2.5% city: 2.0%
- Percentage of males in education, training, and library occupations:
Here: 9.7% city: 3.4%
- Percentage of males in service occupations:
Here: 12.5% city: 16.7%
- Percentage of males in sales and office occupations:
Here: 16.7% city: 11.3%
- Percentage of males in construction, extraction, and maintenance occupations:
Here: 9.0% city: 13.5%
- Percentage of males in production occupations:
Here: 10.1% city: 7.4%
- Percentage of males in transportation occupations:
Here: 1.3% city: 9.2%
- Percentage of males in material moving occupations:
Here: 16.7% city: 12.2%
Occupations of females:
- Percentage of females in management occupations (except farmers):
Here: 1.3% city: 7.7%
- Percentage of females in business and financial operations occupations:
Here: 3.9% city: 3.2%
- Percentage of females in community and social services occupations:
Here: 12.6% city: 2.2%
- Percentage of females in education, training, and library occupations:
Here: 9.9% city: 11.8%
- Percentage of females in arts, design, entertainment, sports, and media occupations:
Here: 1.8% city: 1.9%
- Percentage of females in healthcare practitioners and technical occupations:
Here: 7.8% city: 8.1%
- Percentage of females in service occupations:
Here: 20.8% city: 22.1%
- Percentage of females in sales and office occupations:
Here: 22.1% city: 27.7%
- Percentage of females in production occupations:
Here: 1.8% city: 3.4%
- Percentage of females in material moving occupations:
Here: 18.1% city: 7.7%
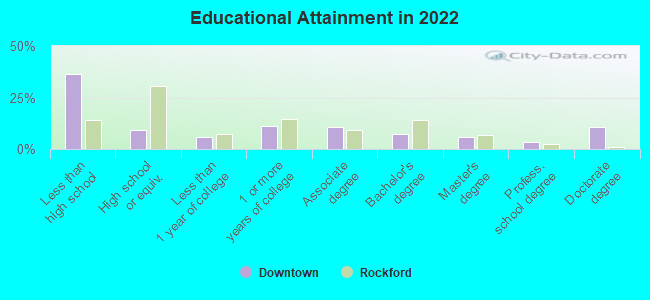
Education in this neighborhood (subdivision or community):
- Percentage of people 3 years and older in K-12 schools:
Downtown: 45.0% Morris: 15.5%
- Percentage of people 3 years and older in undergraduate colleges:
Downtown: 16.0% Morris: 4.1%
- Percentage of people 3 years and older in grad. or professional schools:
Downtown: 8.1% Morris: 1.0%
- Percentage of students K-12 enrolled in private schools:
Downtown: 14.2% Morris: 7.8%
Percentage of population below poverty level:
| Downtown: | 4.1% |
| Morris: | 5.7% |
Median year owner moved in (as recorded in 2022):
Median year renter moved in (as recorded in 2022):
| Downtown: | 2008 |
| Morris: | 2010 |
Median year renter moved in (as recorded in 2022):
| Downtown: | 2017 |
| Morris: | 2016 |
Percentage of married-couple families with both working:
| Downtown: | 184.0% |
| Morris: | 65.9% |
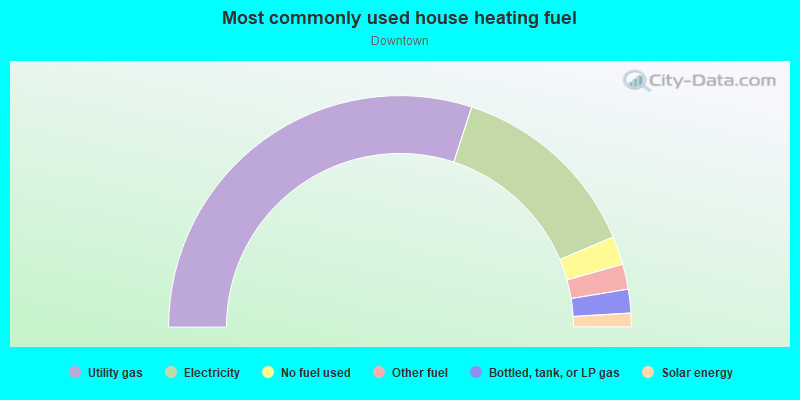
- 68.8%Utility gas
- 12.1%Other fuel
- 10.3%Electricity
- 4.2%Bottled, tank, or LP gas
- 3.4%No fuel used
- 1.2%Fuel oil, kerosene, etc.
Highways in this neighborhood:
State Rte 47 (Division St)
Length: 1.19 miles
Direction: N-S
Direction: N-S
Roads and streets:
Liberty St
Length: 0.52 miles
Direction: N-S
Address range: 100 to 897
Direction: N-S
Address range: 100 to 897
Wauponsee St
Length: 0.51 miles
Direction: N-S
Address range: 100 to 898
Direction: N-S
Address range: 100 to 898
W Illinois Ave
Length: 0.48 miles
Direction: E-W
Address range: 104 to 499
Direction: E-W
Address range: 104 to 499
Fulton St
Length: 0.44 miles
Direction: N-S
Address range: 100 to 816
Direction: N-S
Address range: 100 to 816
Calhoun St
Length: 0.43 miles
Direction: N-S
Address range: 100 to 722
Direction: N-S
Address range: 100 to 722
W Washington St
Length: 0.42 miles
Direction: E-W
Address range: 100 to 699
Direction: E-W
Address range: 100 to 699
Co Rd 2 (W Jefferson St)
Length: 0.40 miles
Direction: E-W
Address range: 100 to 521
Direction: E-W
Address range: 100 to 521
W Main St
Length: 0.32 miles
Direction: E-W
Address range: 100 to 428
Direction: E-W
Address range: 100 to 428
W Jackson St
Length: 0.32 miles
Direction: E-W
Address range: 100 to 426
Direction: E-W
Address range: 100 to 426
Franklin St
Length: 0.32 miles
Direction: N-S
Address range: 200 to 599
Direction: N-S
Address range: 200 to 599
Nettle St
Length: 0.31 miles
Direction: N-S
Address range: 100 to 640
Direction: N-S
Address range: 100 to 640
W North St
Length: 0.24 miles
Direction: E-W
Address range: 100 to 332
Direction: E-W
Address range: 100 to 332
Depot St
Length: 0.20 miles
Direction: E-W
Direction: E-W
W Benton St
Length: 0.16 miles
Direction: E-W
Direction: E-W
W Chapin St
Length: 0.16 miles
Direction: E-W
Direction: E-W
E Benton St
Length: 0.16 miles
Direction: E-W
Address range: 100 to 298
Direction: E-W
Address range: 100 to 298
E Chapin St
Length: 0.16 miles
Direction: E-W
Address range: 100 to 289
Direction: E-W
Address range: 100 to 289
E North St
Length: 0.16 miles
Direction: E-W
Address range: 100 to 278
Direction: E-W
Address range: 100 to 278
Co Rd 2 (E Jefferson St)
Length: 0.16 miles
Direction: E-W
Address range: 100 to 289
Direction: E-W
Address range: 100 to 289
E Washington St
Length: 0.16 miles
Direction: E-W
Address range: 100 to 287
Direction: E-W
Address range: 100 to 287
Main St
Length: 0.15 miles
Direction: E-W
Direction: E-W
Goold Park Dr
Length: 0.15 miles
Directions: E-W, SE-NW, SW-NE
Directions: E-W, SE-NW, SW-NE
Armstrong St
Length: 0.12 miles
Directions: N-S, SW-NE
Address range: 200 to 299
Directions: N-S, SW-NE
Address range: 200 to 299
Jackson St
Length: 0.08 miles
Direction: E-W
Direction: E-W
E Jackson St
Length: 0.08 miles
Direction: E-W
Address range: 100 to 279
Direction: E-W
Address range: 100 to 279
Chapin St
Length: 0.06 miles
Direction: E-W
Direction: E-W
Benton St
Length: 0.05 miles
Direction: E-W
Direction: E-W
Railroad features:
Baltimore and Ohio RR
Length: 1.27 miles
Directions: E-W, SW-NE
Directions: E-W, SW-NE
Other features:
East Frk
Length: 0.26 miles
Directions: E-W, N-S, SE-NW, SW-NE
Directions: E-W, N-S, SE-NW, SW-NE