Downtown neighborhood in Highland Park, Illinois (IL), 60035 detailed profile
Settings
X


Business Search - 14 Million verified businesses
Area: 0.837 square miles
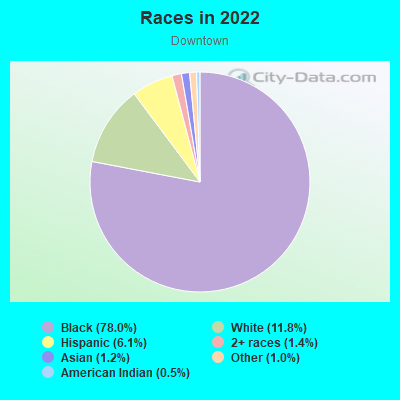
Population: 3,446
Population density:
| Downtown: | 4,117 people per square mile |
| Highland Park: | 2,444 people per square mile |

- 2,65674.4%White
- 60316.9%Hispanic or Latino
- 932.6%Black
- 822.3%Two or more races
- 732.0%Asian
- 611.7%Some other race
Distribution of median household income
![Distribution of median household income]()
- 102Less than $10,000
- 150$10,000 to $19,999
- 210$20,000 to $29,999
- 250$30,000 to $39,999
- 50$40,000 to $49,999
- 156$50,000 to $59,999
- 176$60,000 to $74,999
- 186$75,000 to $99,999
- 244$100,000 to $124,999
- 94$125,000 to $149,999
- 163$150,000 to $199,999
- 362$200,000 or more

Distribution of owner-occupied house/condo value
![Distribution of owner-occupied house/condo value]()
- 24Less than $50,000
- 7$50,000 to $99,999
- 303$100,000 to $149,999
- 88$150,000 to $199,999
- 65$200,000 to $249,999
- 194$250,000 to $299,999
- 195$300,000 to $399,999
- 190$400,000 to $499,999
- 215$500,000 to $749,999
- 187$750,000 to $999,999
- 240$1,000,000 or more

Distribution of rent paid by renters
![Distribution of rent paid by renters]()
- 38$200 to $299
- 49$300 to $399
- 36$400 to $499
- 49$500 to $599
- 313$800 to $899
- 199$900 to $999
- 50$1,000 to $1,249
- 96$1,250 to $1,499
- 263$1,500 to $1,999
- 697$2,000 or more

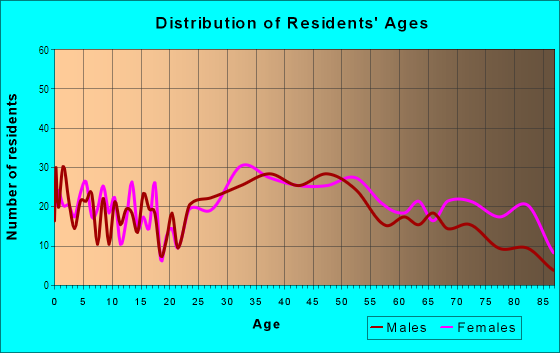
| Males: | 1,541 |
| Females: | 1,904 |
Males:
| This neighborhood: | 48.7 years |
| Whole city: | 46.1 years |
| This neighborhood: | 52.4 years |
| Whole city: | 50.0 years |
Average household size:
| Downtown: | 5.7 people |
| Highland Park: | 2.5 people |
Percentage of family households:
| Downtown: | 25.4% |
| Highland Park: | 46.4% |
| Here: | 37.3% |
| Highland Park: | 64.8% |
Percentage of married-couple families with children (among all households):
| Downtown: | 43.0% |
| Highland Park: | 36.6% |
Percentage of single-mother households (among all households):
| Downtown: | 11.3% |
| Highland Park: | 2.3% |
Percentage of never married males 15 years old and over:
Percentage of never married females 15 years old and over:
| Downtown: | 8.5% |
| Highland Park: | 8.4% |
Percentage of never married females 15 years old and over:
| Downtown: | 13.7% |
| city: | 9.2% |
Percentage of people that speak English not well or not at all:
| Downtown: | 4.3% |
| Highland Park: | 1.3% |
Percentage of people born in this state:
Percentage of people born in another U.S. state:
Percentage of native residents but born outside the U.S.:
Percentage of foreign born residents:
| Here: | 58.1% |
| Highland Park: | 60.4% |
Percentage of people born in another U.S. state:
| Downtown: | 27.2% |
| Highland Park: | 27.2% |
Percentage of native residents but born outside the U.S.:
| Here: | 0.7% |
| city: | 1.2% |
Percentage of foreign born residents:
| Here: | 14.1% |
| Highland Park: | 11.2% |
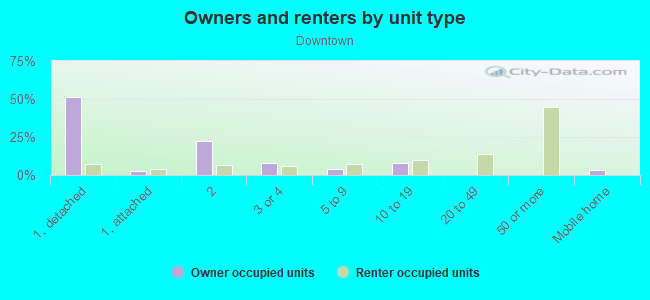
Owner-occupied
Renter-occupied

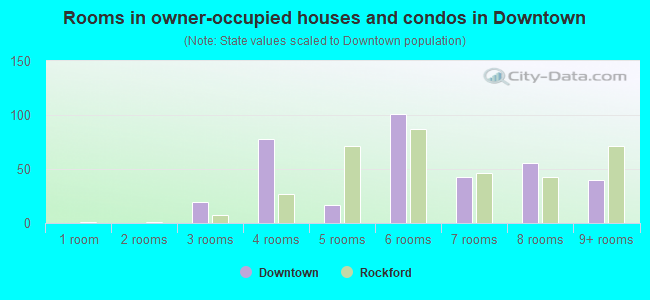
- Rooms in owner-occupied houses and condos in Downtown
- 01 room
- 02 rooms
- 1313 rooms
- 1904 rooms
- 1525 rooms
- 1676 rooms
- 1457 rooms
- 1978 rooms
- 1799+ rooms
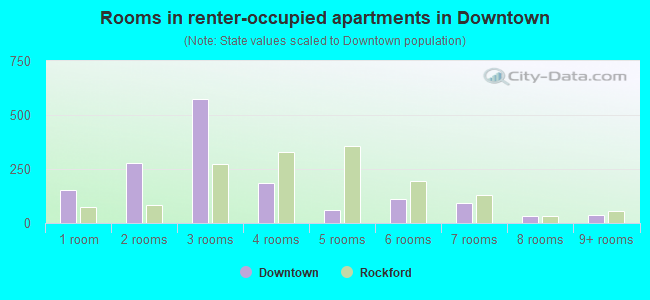
- Rooms in renter-occupied apartments in Downtown
- 2661 room
- 1372 rooms
- 1343 rooms
- 2794 rooms
- 1855 rooms
- 856 rooms
- 157 rooms
- 928 rooms
- 559+ rooms
Owner-occupied
Renter-occupied
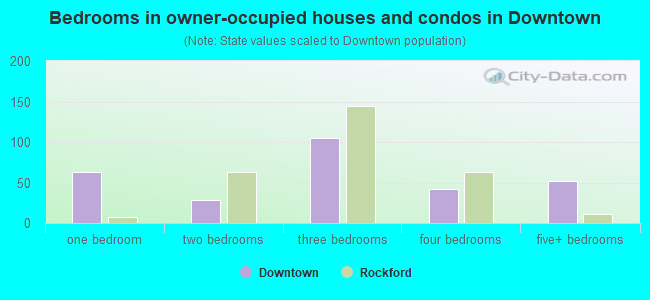
- Bedrooms in owner-occupied houses and condos in Downtown
- 0no bedroom
- 141 bedroom
- 5812 bedrooms
- 3563 bedrooms
- 1274 bedrooms
- 1125+ bedrooms
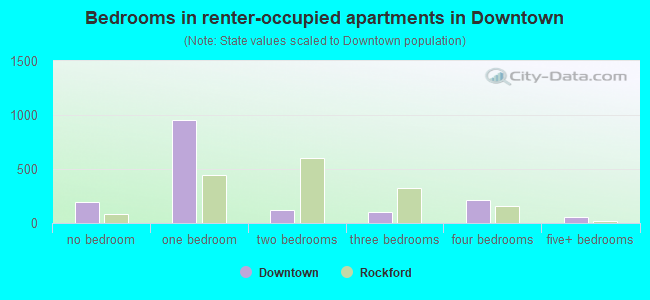
- Bedrooms in renter-occupied apartments in Downtown
- 276no bedroom
- 2691 bedroom
- 3842 bedrooms
- 1273 bedrooms
- 464 bedrooms
- 85+ bedrooms
Average number of cars or other vehicles available in houses/condos:
Average number of cars or other vehicles available in apartments:
| This neighborhood: | 1.5 |
| Highland Park: | 1.9 |
Average number of cars or other vehicles available in apartments:
| Here: | |
| city: |
Percentage of units with a mortgage:
| Downtown: | 52.2% |
| Highland Park: | 67.4% |
Average estimated value of detached houses in 2022 (27.7% of all units):
| Downtown: | $1,236,533 |
| Highland Park: | $740,325 |
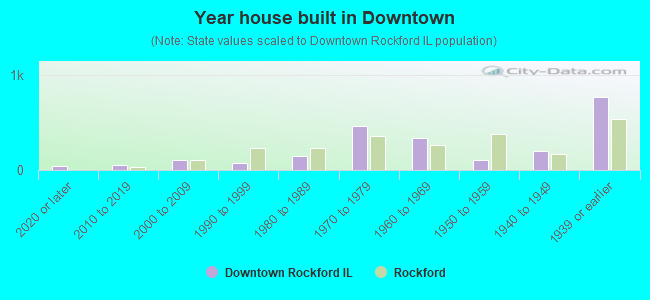
- Year house built in Downtown
- 382020 or later
- 3992010 to 2019
- 3322000 to 2009
- 3331990 to 1999
- 1271980 to 1989
- 2151970 to 1979
- 1771960 to 1969
- 1691950 to 1959
- 701940 to 1949
- 5471939 or earlier
City-data.com crime index for city in 2020 (higher means more crime):
| City: | 2.6 |
| U.S. average: | 219.5 |
Travel time to work (commute)
![Travel time to work (commute)]()
- 46Less than 5 minutes
- 2755 to 9 minutes
- 9810 to 14 minutes
- 22615 to 19 minutes
- 17220 to 24 minutes
- 11525 to 29 minutes
- 14530 to 34 minutes
- 2235 to 39 minutes
- 5540 to 44 minutes
- 6045 to 59 minutes
- 16460 to 89 minutes
- 1890 or more minutes

Means of transportation to work
![Means of transportation to work]()
- 68.9%1,132Drove a car alone
- 2.9%48Carpooled
- 2.3%38Bus
- 1.1%18Subway or elevated rail
- 4.8%79Long-distance train or commuter rail
- 0.5%8Light rail, streetcar or trolley
- 3.6%59Taxi
- 10.4%171Walked
- 0.7%12Other means
- 15.4%253Worked at home

Time leaving home to go to work
![Time leaving home to go to work]()
- 1712:00 a.m. to 4:59 a.m.
- 405:00 a.m. to 5:29 a.m.
- 335:30 a.m. to 5:59 a.m.
- 1296:00 a.m. to 6:29 a.m.
- 816:30 a.m. to 6:59 a.m.
- 2487:00 a.m. to 7:29 a.m.
- 2087:30 a.m. to 7:59 a.m.
- 2408:00 a.m. to 8:29 a.m.
- 1448:30 a.m. to 8:59 a.m.
- 1019:00 a.m. to 9:59 a.m.
- 9610:00 a.m. to 10:59 a.m.
- 3711:00 a.m. to 11:59 a.m.
- 8612:00 p.m. to 3:59 p.m.
- 594:00 p.m. to 11:59 p.m.

Occupations of males:
- Percentage of males in management occupations (except farmers):
Here: 17.1% city: 25.1%
- Percentage of males in business and financial operations occupations:
Here: 8.5% city: 12.0%
- Percentage of males in computer and mathematical occupations:
Here: 8.4% city: 4.7%
- Percentage of males in architecture and engineering occupations:
Here: 1.4% city: 1.2%
- Percentage of males in legal occupations:
Here: 1.2% city: 7.4%
- Percentage of males in education, training, and library occupations:
Here: 1.5% city: 3.9%
- Percentage of males in arts, design, entertainment, sports, and media occupations:
Here: 4.0% city: 2.6%
- Percentage of males in healthcare practitioners and technical occupations:
Here: 2.1% city: 7.8%
- Percentage of males in service occupations:
Here: 27.9% city: 7.7%
- Percentage of males in sales and office occupations:
Here: 17.3% city: 18.3%
- Percentage of males in construction, extraction, and maintenance occupations:
Here: 3.6% city: 1.8%
- Percentage of males in production occupations:
Here: 4.0% city: 1.5%
- Percentage of males in material moving occupations:
Here: 2.1% city: 1.4%
Occupations of females:
- Percentage of females in management occupations (except farmers):
Here: 24.1% city: 20.6%
- Percentage of females in business and financial operations occupations:
Here: 3.7% city: 7.7%
- Percentage of females in computer and mathematical occupations:
Here: 2.5% city: 0.9%
- Percentage of females in life, physical, and social science occupations:
Here: 3.2% city: 3.8%
- Percentage of females in legal occupations:
Here: 8.4% city: 4.9%
- Percentage of females in education, training, and library occupations:
Here: 9.6% city: 13.2%
- Percentage of females in arts, design, entertainment, sports, and media occupations:
Here: 2.2% city: 4.7%
- Percentage of females in healthcare practitioners and technical occupations:
Here: 11.3% city: 7.6%
- Percentage of females in service occupations:
Here: 12.7% city: 10.8%
- Percentage of females in sales and office occupations:
Here: 19.5% city: 17.3%
- Percentage of females in material moving occupations:
Here: 1.2% city: 1.0%
Percentage of people 16-64 in Armed Forces:
| Downtown: | 0.6% |
| Highland Park: | 1.0% |
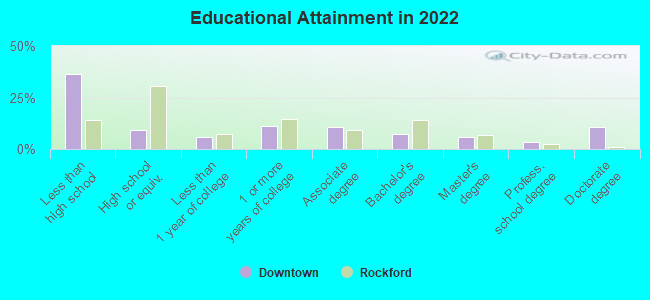
Education in this neighborhood (subdivision or community):
- Percentage of people 3 years and older in K-12 schools:
Downtown: 15.6% Highland Park: 18.4%
- Percentage of people 3 years and older in undergraduate colleges:
Downtown: 3.7% Highland Park: 2.7%
- Percentage of people 3 years and older in grad. or professional schools:
Downtown: 1.9% Highland Park: 1.0%
- Percentage of students K-12 enrolled in private schools:
Downtown: 18.2% Highland Park: 13.4%
Percentage of population below poverty level:
| Downtown: | 2.9% |
| Highland Park: | 3.4% |
Median year owner moved in (as recorded in 2022):
| Downtown: | 2006 |
| Highland Park: | 2006 |
Percentage of married-couple families with both working:
| Downtown: | 83.7% |
| Highland Park: | 77.7% |
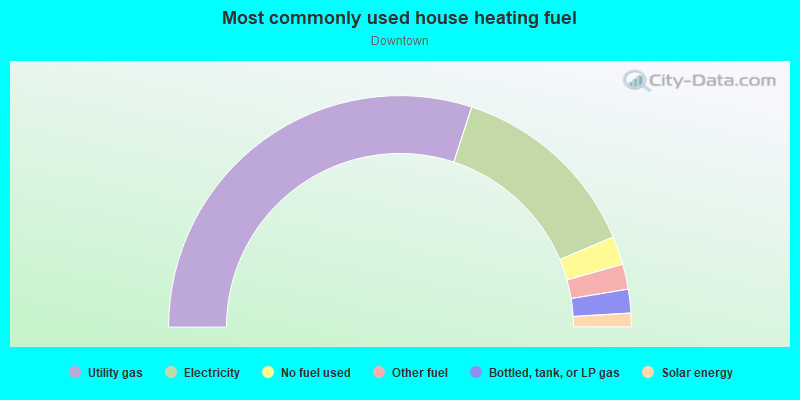
- 68.8%Utility gas
- 16.8%Electricity
- 9.9%No fuel used
- 2.8%Other fuel
- 1.8%Bottled, tank, or LP gas
Roads and streets:
Central Ave
Length: 1.47 miles
Direction: E-W
Address range: 1 to 976
Direction: E-W
Address range: 1 to 976
Laurel Ave
Length: 1.37 miles
Directions: E-W, SW-NE
Address range: 1 to 899
Directions: E-W, SW-NE
Address range: 1 to 899
Green Bay Rd
Length: 1.01 miles
Directions: N-S, SE-NW
Address range: 1600 to 2324
Directions: N-S, SE-NW
Address range: 1600 to 2324
Sheridan Rd (St Johns Ave)
Length: 0.83 miles
Directions: N-S, SE-NW
Address range: 1650 to 2339
Directions: N-S, SE-NW
Address range: 1650 to 2339
1st St
Length: 0.78 miles
Directions: N-S, SE-NW
Address range: 556 to 2199
Directions: N-S, SE-NW
Address range: 556 to 2199
Park Ave
Length: 0.77 miles
Directions: E-W, SW-NE
Address range: 1 to 1600
Directions: E-W, SW-NE
Address range: 1 to 1600
Vine Ave
Length: 0.76 miles
Direction: E-W
Address range: 300 to 799
Direction: E-W
Address range: 300 to 799
St Johns Ave
Length: 0.70 miles
Directions: E-W, N-S, SE-NW
Address range: 1800 to 2351
Directions: E-W, N-S, SE-NW
Address range: 1800 to 2351
Elm Pl
Length: 0.68 miles
Direction: E-W
Address range: 300 to 799
Direction: E-W
Address range: 300 to 799
Central Ct
Length: 0.62 miles
Direction: E-W
Address range: 100 to 499
Direction: E-W
Address range: 100 to 499
2nd St
Length: 0.60 miles
Direction: SE-NW
Address range: 1600 to 2099
Direction: SE-NW
Address range: 1600 to 2099
Deerfield Rd
Length: 0.46 miles
Directions: E-W, SE-NW
Address range: 701 to 998
Directions: E-W, SE-NW
Address range: 701 to 998
Homewood Ave
Length: 0.45 miles
Directions: E-W, N-S, SE-NW
Address range: 600 to 699
Directions: E-W, N-S, SE-NW
Address range: 600 to 699
Sunset Rd
Length: 0.44 miles
Directions: N-S, SE-NW
Address range: 1600 to 1999
Directions: N-S, SE-NW
Address range: 1600 to 1999
Linden Ave
Length: 0.38 miles
Directions: N-S, SE-NW
Address range: 1830 to 2109
Directions: N-S, SE-NW
Address range: 1830 to 2109
Park Ave W
Length: 0.37 miles
Directions: E-W, SE-NW
Address range: 600 to 799
Directions: E-W, SE-NW
Address range: 600 to 799
Midlothian Ave
Length: 0.33 miles
Direction: N-S
Address range: 2000 to 2299
Direction: N-S
Address range: 2000 to 2299
Onwentsia Ave
Length: 0.26 miles
Direction: E-W
Address range: 500 to 699
Direction: E-W
Address range: 500 to 699
Linden Park Pl
Length: 0.23 miles
Direction: SW-NE
Address range: 154 to 399
Direction: SW-NE
Address range: 154 to 399
McGovern St
Length: 0.22 miles
Direction: SE-NW
Address range: 1600 to 1799
Direction: SE-NW
Address range: 1600 to 1799
Walnut St
Length: 0.21 miles
Direction: E-W
Address range: 600 to 699
Direction: E-W
Address range: 600 to 699
Skokie Ave
Length: 0.21 miles
Direction: E-W
Address range: 500 to 699
Direction: E-W
Address range: 500 to 699
Dale Ave
Length: 0.20 miles
Direction: SE-NW
Address range: 1900 to 2099
Direction: SE-NW
Address range: 1900 to 2099
Maple Ave
Length: 0.19 miles
Direction: E-W
Address range: 249 to 1683
Direction: E-W
Address range: 249 to 1683
Glenview Ave
Length: 0.17 miles
Direction: E-W
Address range: 500 to 644
Direction: E-W
Address range: 500 to 644
Hickory St
Length: 0.14 miles
Direction: SE-NW
Address range: 1600 to 1699
Direction: SE-NW
Address range: 1600 to 1699
Belle Ln (Belle Ave)
Length: 0.13 miles
Directions: E-W, SW-NE
Address range: 100 to 199
Directions: E-W, SW-NE
Address range: 100 to 199
Lake Ave
Length: 0.10 miles
Direction: SE-NW
Address range: 1900 to 1999
Direction: SE-NW
Address range: 1900 to 1999
Exmoor Oaks Dr
Length: 0.09 miles
Directions: E-W, N-S
Address range: 700 to 801
Directions: E-W, N-S
Address range: 700 to 801
Park Ln
Length: 0.06 miles
Direction: SE-NW
Address range: 2000 to 2199
Direction: SE-NW
Address range: 2000 to 2199
Maple Ln
Length: 0.05 miles
Direction: SE-NW
Address range: 2300 to 2399
Direction: SE-NW
Address range: 2300 to 2399
Sheahen Ct
Length: 0.05 miles
Direction: N-S
Address range: 1800 to 1899
Direction: N-S
Address range: 1800 to 1899
Egandale Rd
Length: 0.02 miles
Direction: SE-NW
Address range: 2100 to 2115
Direction: SE-NW
Address range: 2100 to 2115
Railroad features:
Chicago and North Western RR
Length: 0.78 miles
Direction: SE-NW
Direction: SE-NW